Overview
Managed System Add-ons can be added to a cluster blueprint and be deployed on clusters. Once enabled in a blueprint, the required k8s software components and configuration are automatically deployed to the target clusters. Support and technical assistance is provided for the Managed Add-ons and Services.
| Managed System Addons | Components | Supported Distros |
|---|---|---|
| Managed Storage | Rook-Ceph | Upstream k8s |
| Managed Storage | GlusterFS (Deprecated) | Upstream k8s |
| Ingress Controller | Ingress Nginx | All |
| Monitoring & Alerting | Prometheus | All |
| Monitoring & Alerting | Metrics Server | All |
| Monitoring & Alerting | Alert Manager | All |
| Secrets Store CSI Driver | Secret Store CSI driver + AWS Secrets Manager provider specific plugins | Amazon EKS |
| Node Termination Handler | AWS Node Termination Handler (Deprecated) | Amazon EKS |
Managed Services
Managed Services are turnkey, high value integrations that can be based on either open source or purpose built software. Once enabled, the required k8s software components and configuration are automatically deployed to the target clusters. Support and technical assistance is provided for Managed Services.
| Managed Services | Components | Supported Distros |
|---|---|---|
| Monitoring & Alerting | Prometheus | All |
| Monitoring & Alerting | Metrics Server | All |
| Policy Management | OPA Gatekeeper | All |
| Backup & Restore | Velero | All |
| Network Policy | Cilium | All |
Mandatory Addons
The k8s Management Operator is selected by default and users are not allowed to disable this add-on. This is required for centralized management of Kubernetes clusters.
Optional Addons
Managed Storage
Managed Storage enables the Ceph/Rook storage addon, which can be deployed to your cluster(s) during provision to avail distributed storage systems. On selecting the check box, a wrench settings icon appears. Click on the icon to view the enablement of Rook Ceph Storage
Ingress Controller
Ingress controller, selected by default in the Controller, is a specialized load balancer for Kubernetes (and other containerized) environments. This specific add-on accepts traffic from outside the Kubernetes platform and load balance it to pods (containers) running inside the platform. It monitors the pods running in Kubernetes and automatically update the load‑balancing rules when pods are added or removed from a service
Monitoring & Alerting
Monitoring & Alerting, selected by default, collects the various metrics from different system services and generates alerts. This specific add-on helps to record real-time metrics in a time series database (allowing for high dimensionality), with real-time alerting. Users are allowed to customize the Monitoring & Alerting add-on. Click the Wrench icon of the Monitoring & Alerts and the Customize Prometheus Addons pane appears to the right
Customize Prometheus Add-On
Enabling Monitoring & Alerting Add-ons helps to update the controller dashboards of various metrics associated with clusters.
-
Kube State Metrics: Exposes Prometheus format metrics based on the current state of the Kubernetes resources and this component is selected by default. To provide your own Kube State Metrics, perform the following steps:
- Disable the Kube State Metrics component by clearing the checkbox
- Provide the Kubernetes Namespace where the Kube State Metrics has been deployed in the cluster
- Select the resource to discover Service or Pod
- Click Add Key-Value Labels to add one or more labels for discovering the Service or Pod
These information are collected and forwarded to the Time Series Database. Time Series Database (TSDB) is specifically for handling metrics and events or measurements that are time-stamped and these data change over time
-
Node Exporter: Exposes Prometheus format metrics based on the current state of the Kubernetes nodes and this metric is selected by default. A Prometheus Node Exporter fetch statistics from an application, converts those statistics into metrics, and expose them to the controller. To provide your own Node Exporter, perform the following steps:
- Disable the Node Exporter component by clearing the checkbox
- Provide the Kubernetes Namespace where the Node Exporter has been deployed in the cluster
- Select the resource to discover Service or Pod
- Click Add Key-Value Labels to add one or more labels for discovering the Service or Pod
-
Helm Exporter: Exposes helm release, chart, and version statistics in the controller. To provide your own Helm Exporter, perform the following steps:
- Disable the Helm Exporter component by clearing the checkbox
- Provide the Kubernetes Namespace where the Helm Exporter has been deployed in the cluster
- Select the resource to discover Service or Pod
- Click Add Key-Value Labels to add one or more labels for discovering the Service or Pod
Kube State Metrics, Node Exporter, and Helm Exporter plays a major role in exposing the metrics in the controller dashboard. Invalid data might break the dashboard.
Note
To disable a Prometheus Addon, clear the checkbox.
-
Prometheus Adapter: Prometheus Adapter is used for HPA (Horizontal Pod Autoscaler). Enabling this metric to use for automatically scaling workload up or down based on resource usage. In Kubernetes, the Horizontal Pod Autoscaler (HPA) can scale pods based on observed CPU utilization and memory usage
-
Metrics Server: Metrics Server provides metrics for resource utilization like CPU & Memory. This metric discovers all the nodes in the cluster and forwards the details for resource utilization
Important
Disable Prometheus Adapter and Metrics Server to deploy AKS clusters
GPU Operator
-
GPU Operator: To install the GPU Operator and have the dashboards work, users can either provide the name
gpu-operator-resourcesand install the GPU Operator, or enable the GPU Operator option to install it in any namespace. When enabling this option, users must specify the resource type as either Service or Pod, and add the required key-value labels, which are mandatory for proper configuration. If the GPU Operator option is not enabled, the GPU Operator must be installed in the gpu-operator-resources namespace for the dashboards to function correctly -
Resources Limits (Optional): Specify the number of resources a Container needs. Users can set the CPU and Memory Limits for the resources. The Kubelet enforces those limits so that the running container is not allowed to use more of the resource than the limit set for it
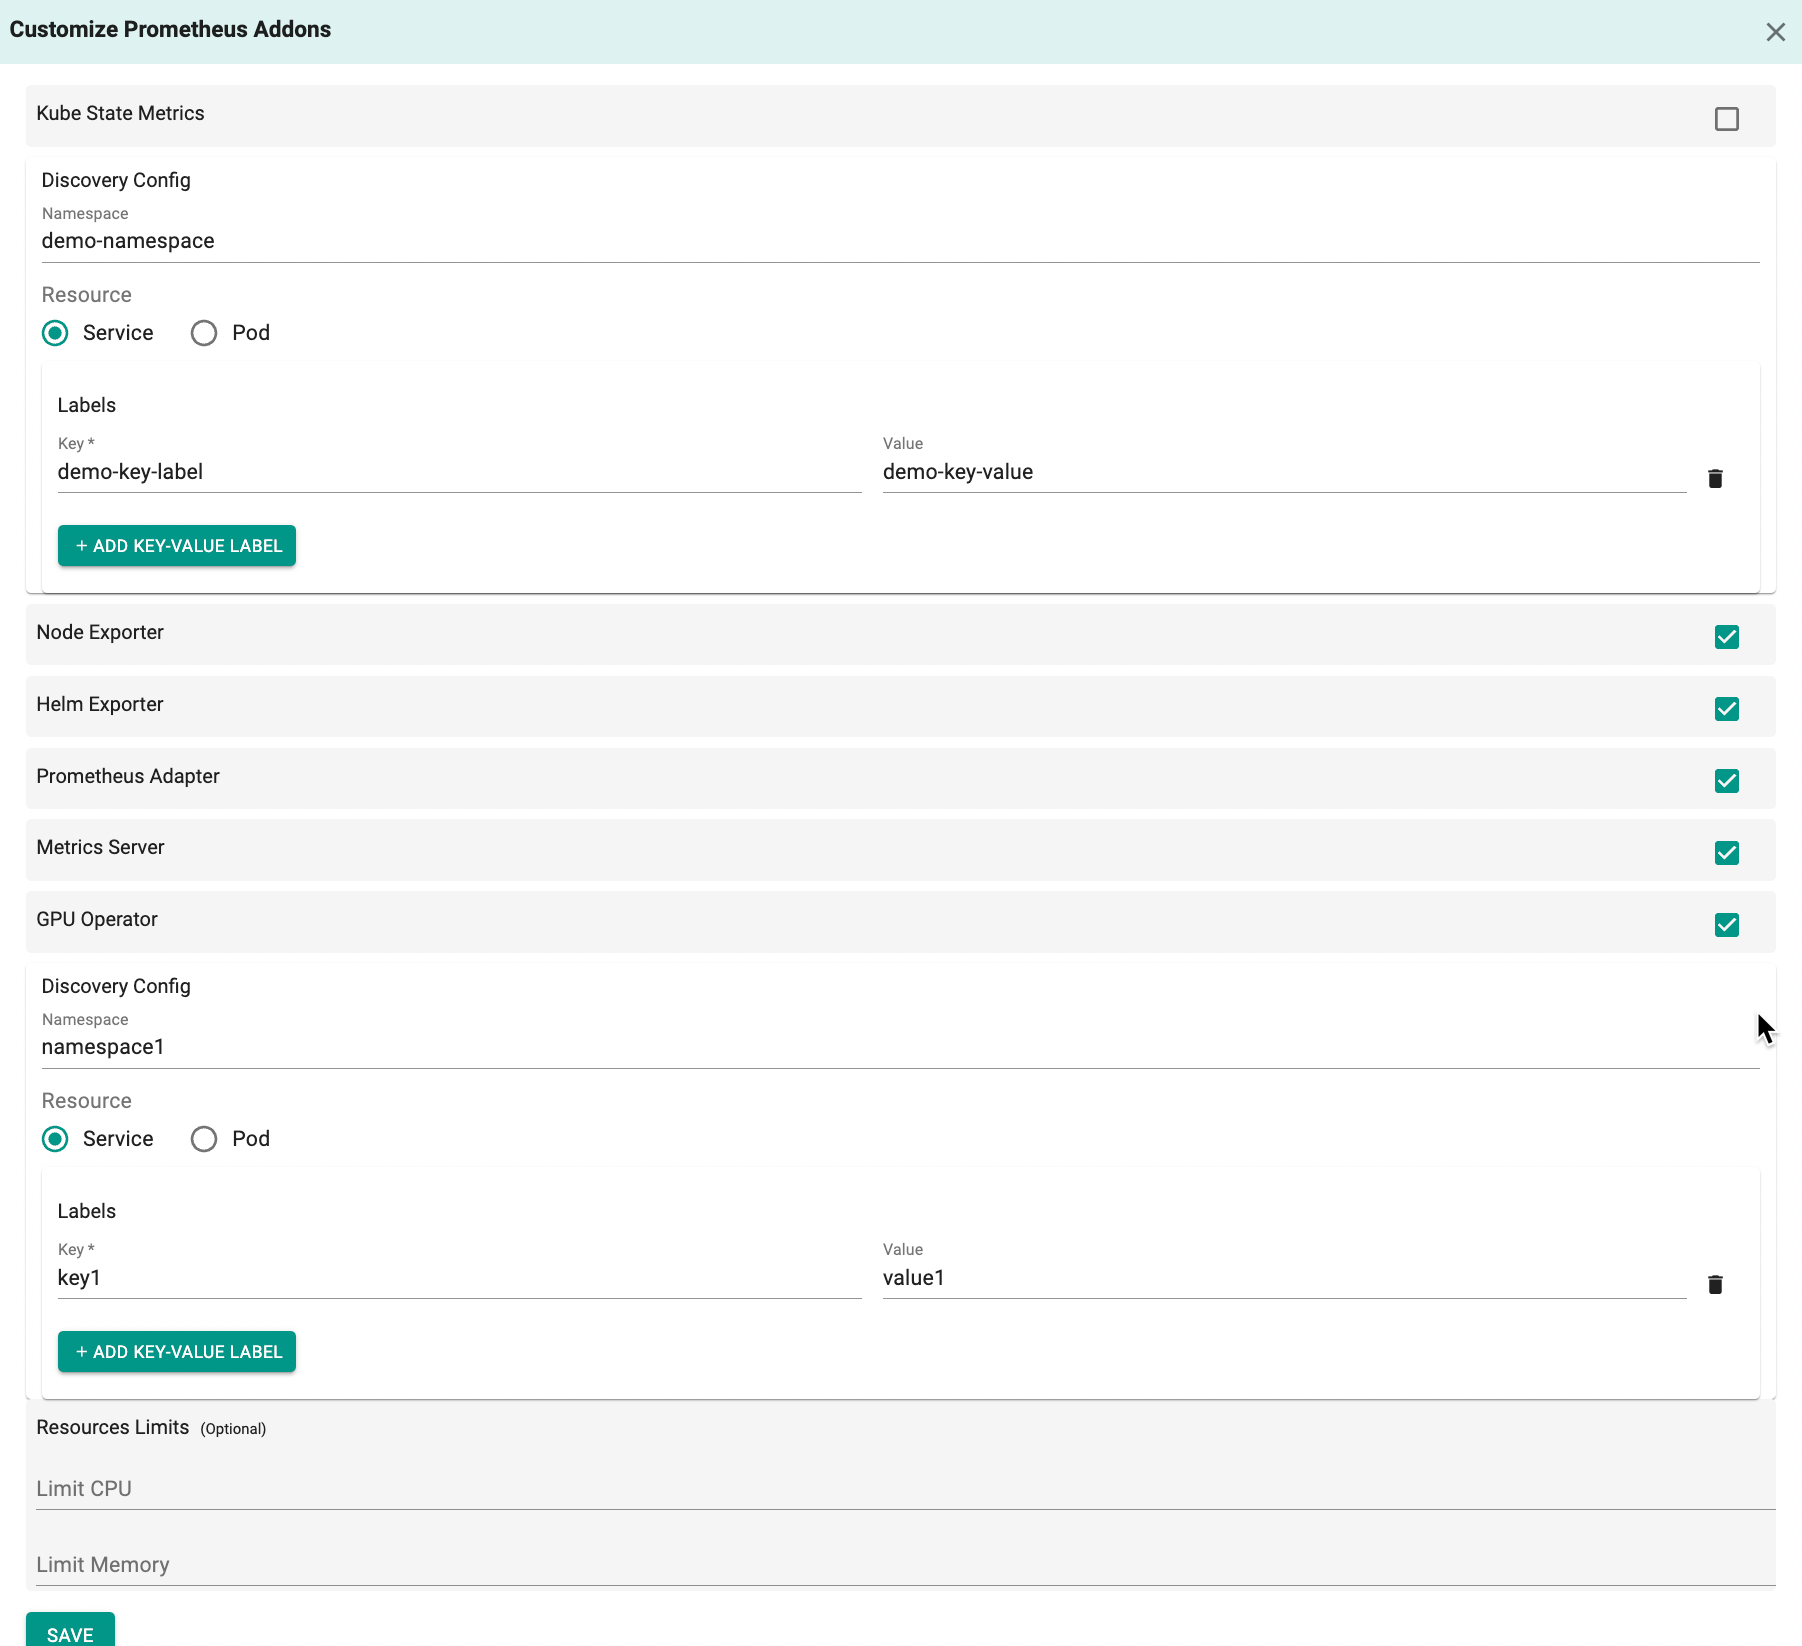
Click Save to apply all the changes made to the Monitoring & Alerting add-ons
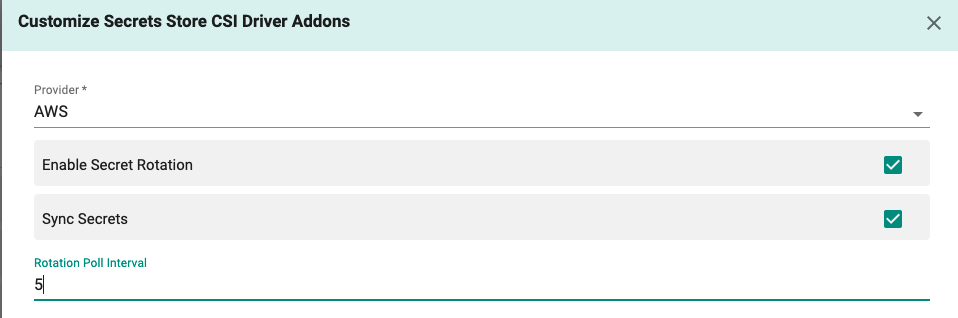
Secrets Store CSI Driver
During the pod start/restart, Secrets Store CSI Driver communicates with the provider using gRPC to retrieve the secret content from the external Secrets Store specified in the SecretProviderClass custom resource. The AWS provider for the Secrets Store CSI Driver allows you to make secrets stored in Secrets Manager appear as files mounted in Kubernetes pods.
Important
Only AWS provider is currently supported
- Click the Wrench icon to customize the CSI Driver parameters. Customize Secrets Store CSI Driver Addons window appears
- Select the required parameters of the CSI Driver and close the window to save the changes. Rotation poll interval can be customized when 'Enable Secret Rotation' setting is selected, the default being 2 min
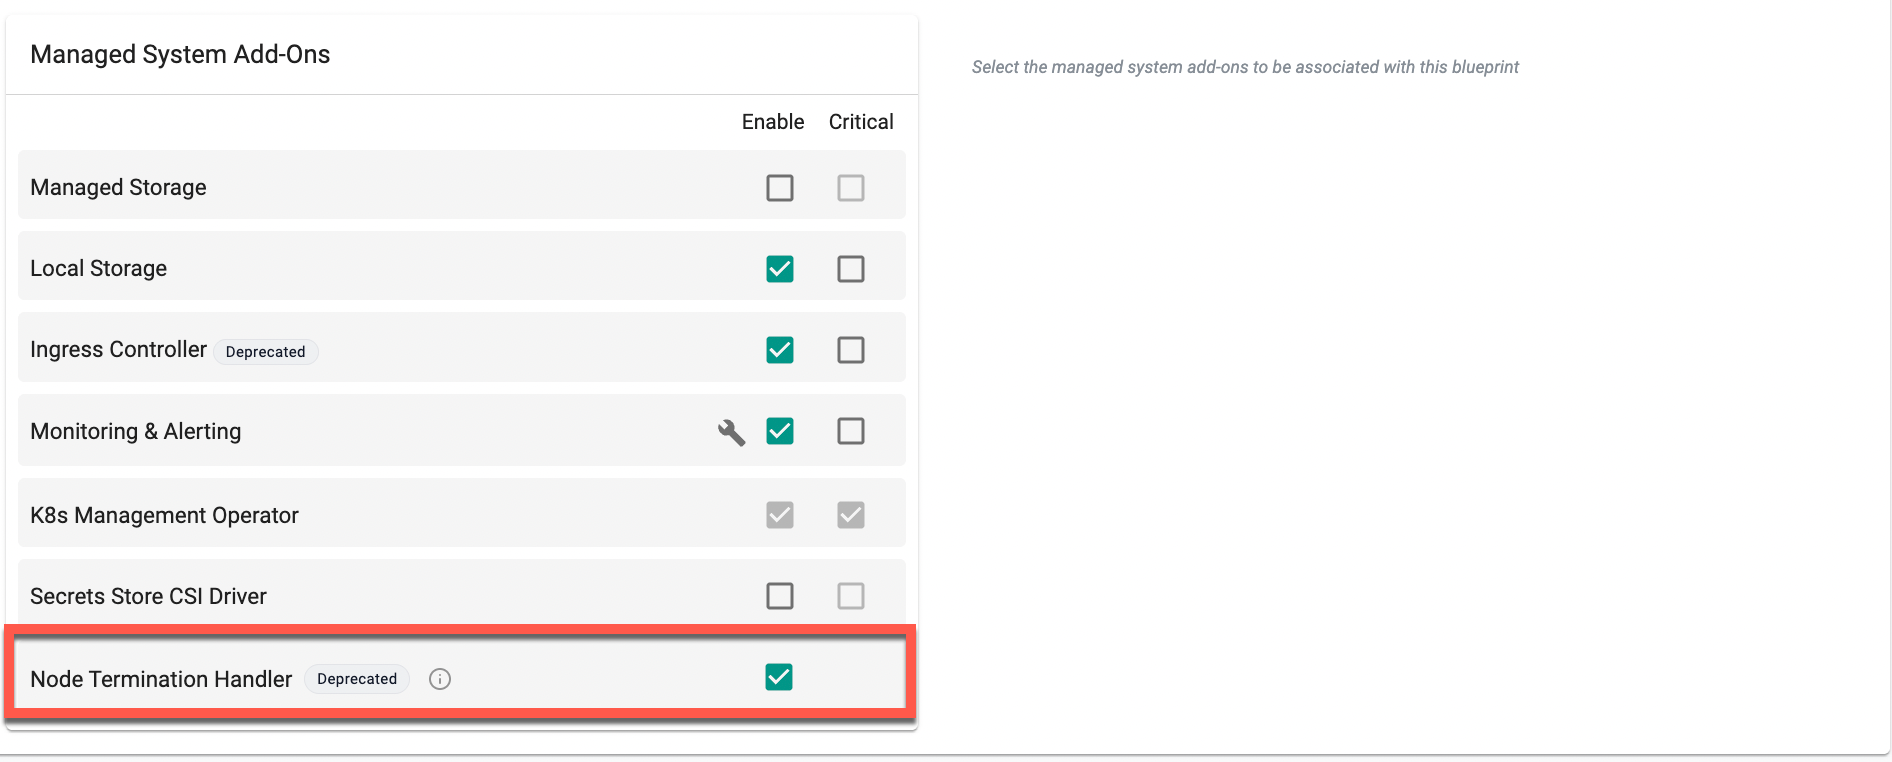
Node Termination Handler (Amazon EKS only)
The AWS Node Termination Handler is a managed system add-on that handles EC2 interruption events such as Spot interruptions, scheduled maintenance, instance terminations, and other lifecycle events.
For Amazon EKS clusters, this add-on is enabled by default when the Default Blueprint is selected.
The add-on can be disabled during blueprint configuration by disabling the Node Termination Handler option under Managed System Add-Ons. When disabled, the add-on is not installed on the target clusters.
If the option is not explicitly disabled, the add-on remains enabled by default.