Nodes
The Web Console also provides Infrastructure admins with a detailed view into the status and health of the nodes that comprise a cluster.
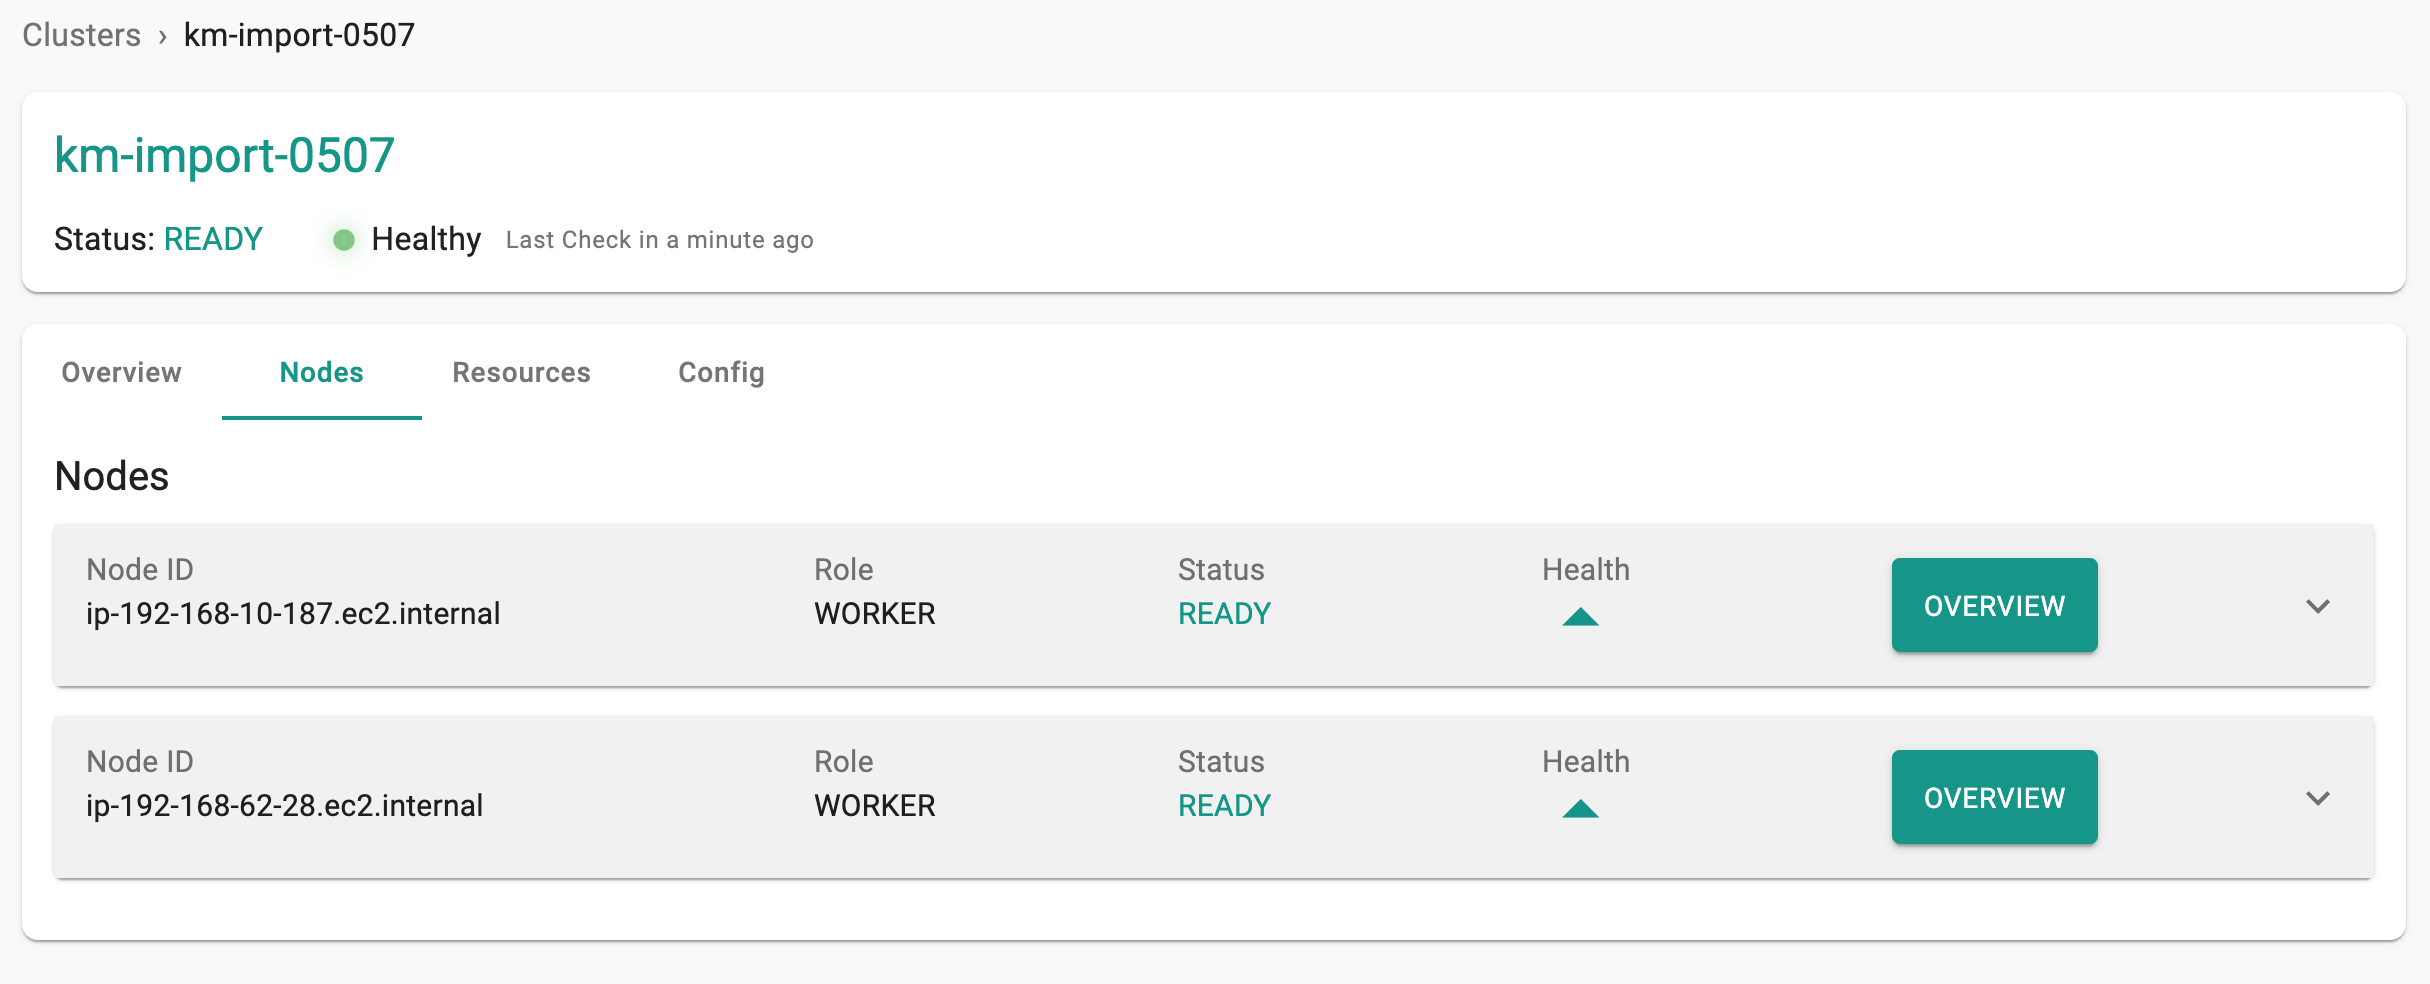
All Nodes
Click on the Nodes tab in the Cluster Dashboard to view a list of all nodes, their health
Node Dashboard
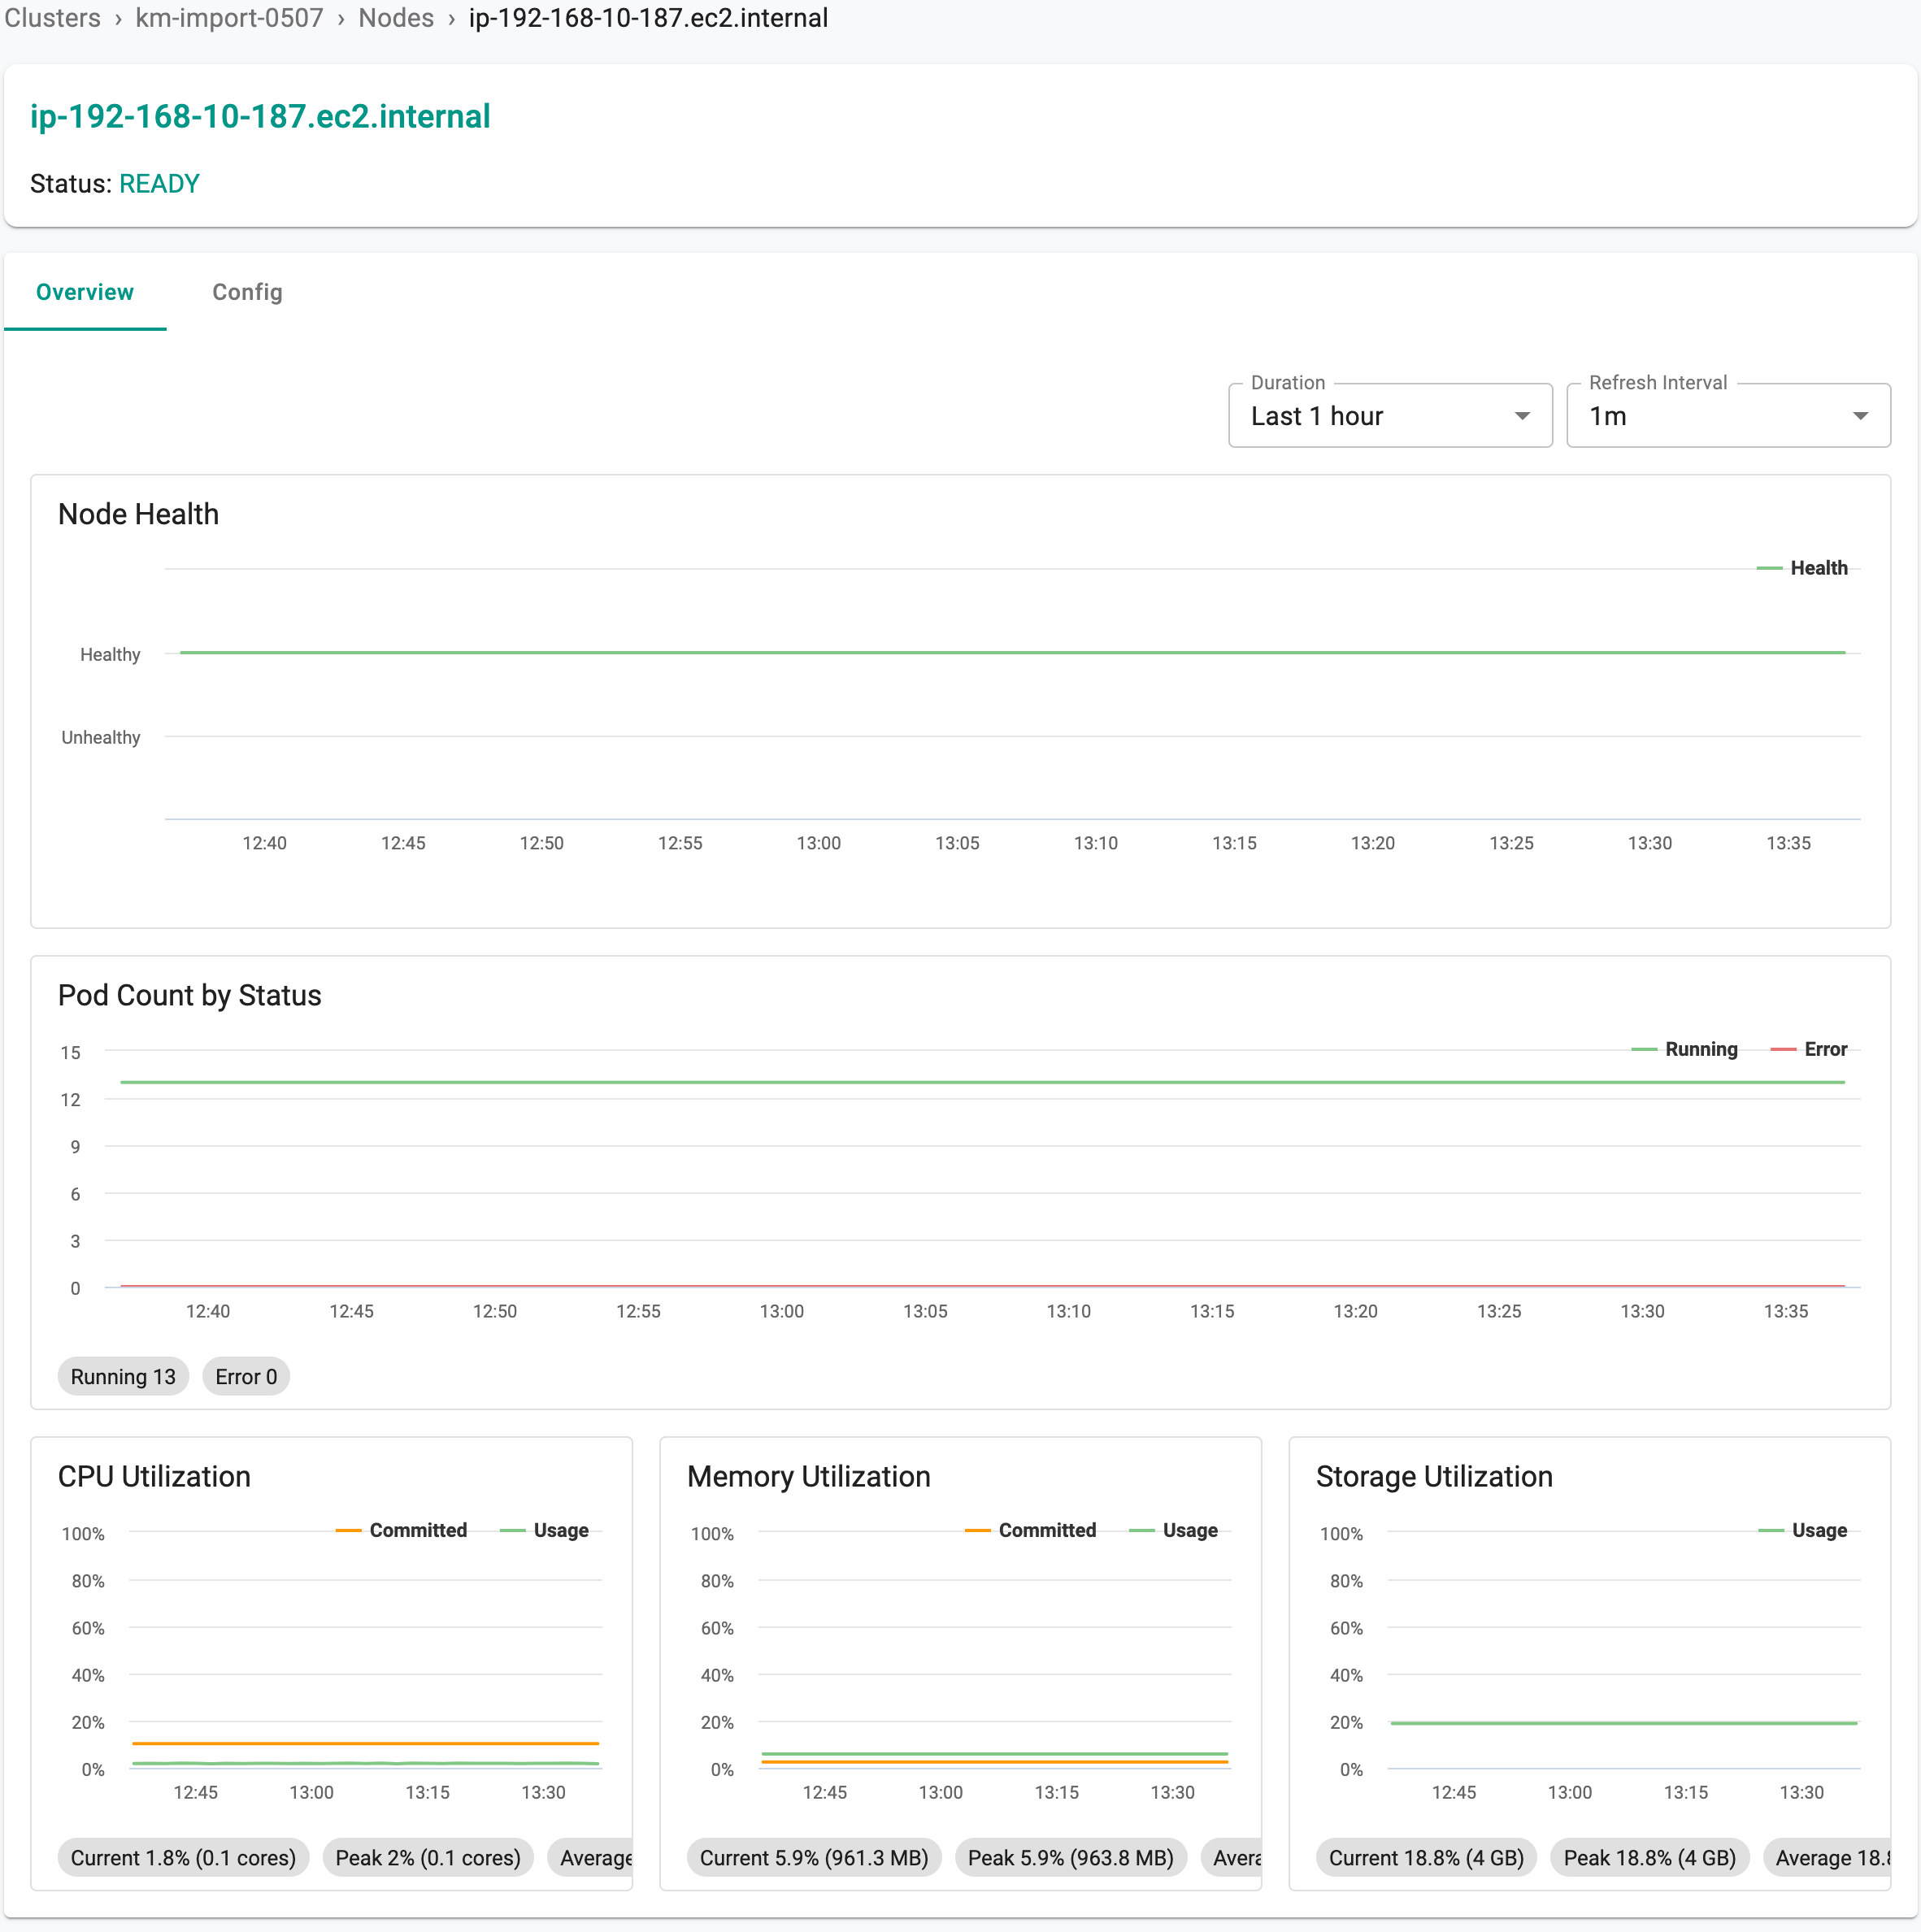
Click on "Overview" to access the Node's dashboard.
Node Health Timeline The node health timeline presents the health of the node over the specified time period. This view can be critical for Infrastructure teams to determine when and how long a node was unhealthy.
In the example below, the node has been healthy without issues in the specified time period.
Pod Count by Status A timeline view is presented showing the count of pods scheduled on the node organized by their status (Running or Error).
In the example below, there are a total of 13 pods on this node with zero pods in Error state.
Resource Utilization Timeline
Node Resource (CPU, Memory and Storage) utilization trends are presented with a view into current utilization as well.
For CPU and Memory, both "Committed" and "Actual" utilization data is presented. This information can be critical for infrastructure admins in determining if the node is correctly resourced or not.
Click Config to access Node Configuration details such as IP, storage, version, labels, and taints.
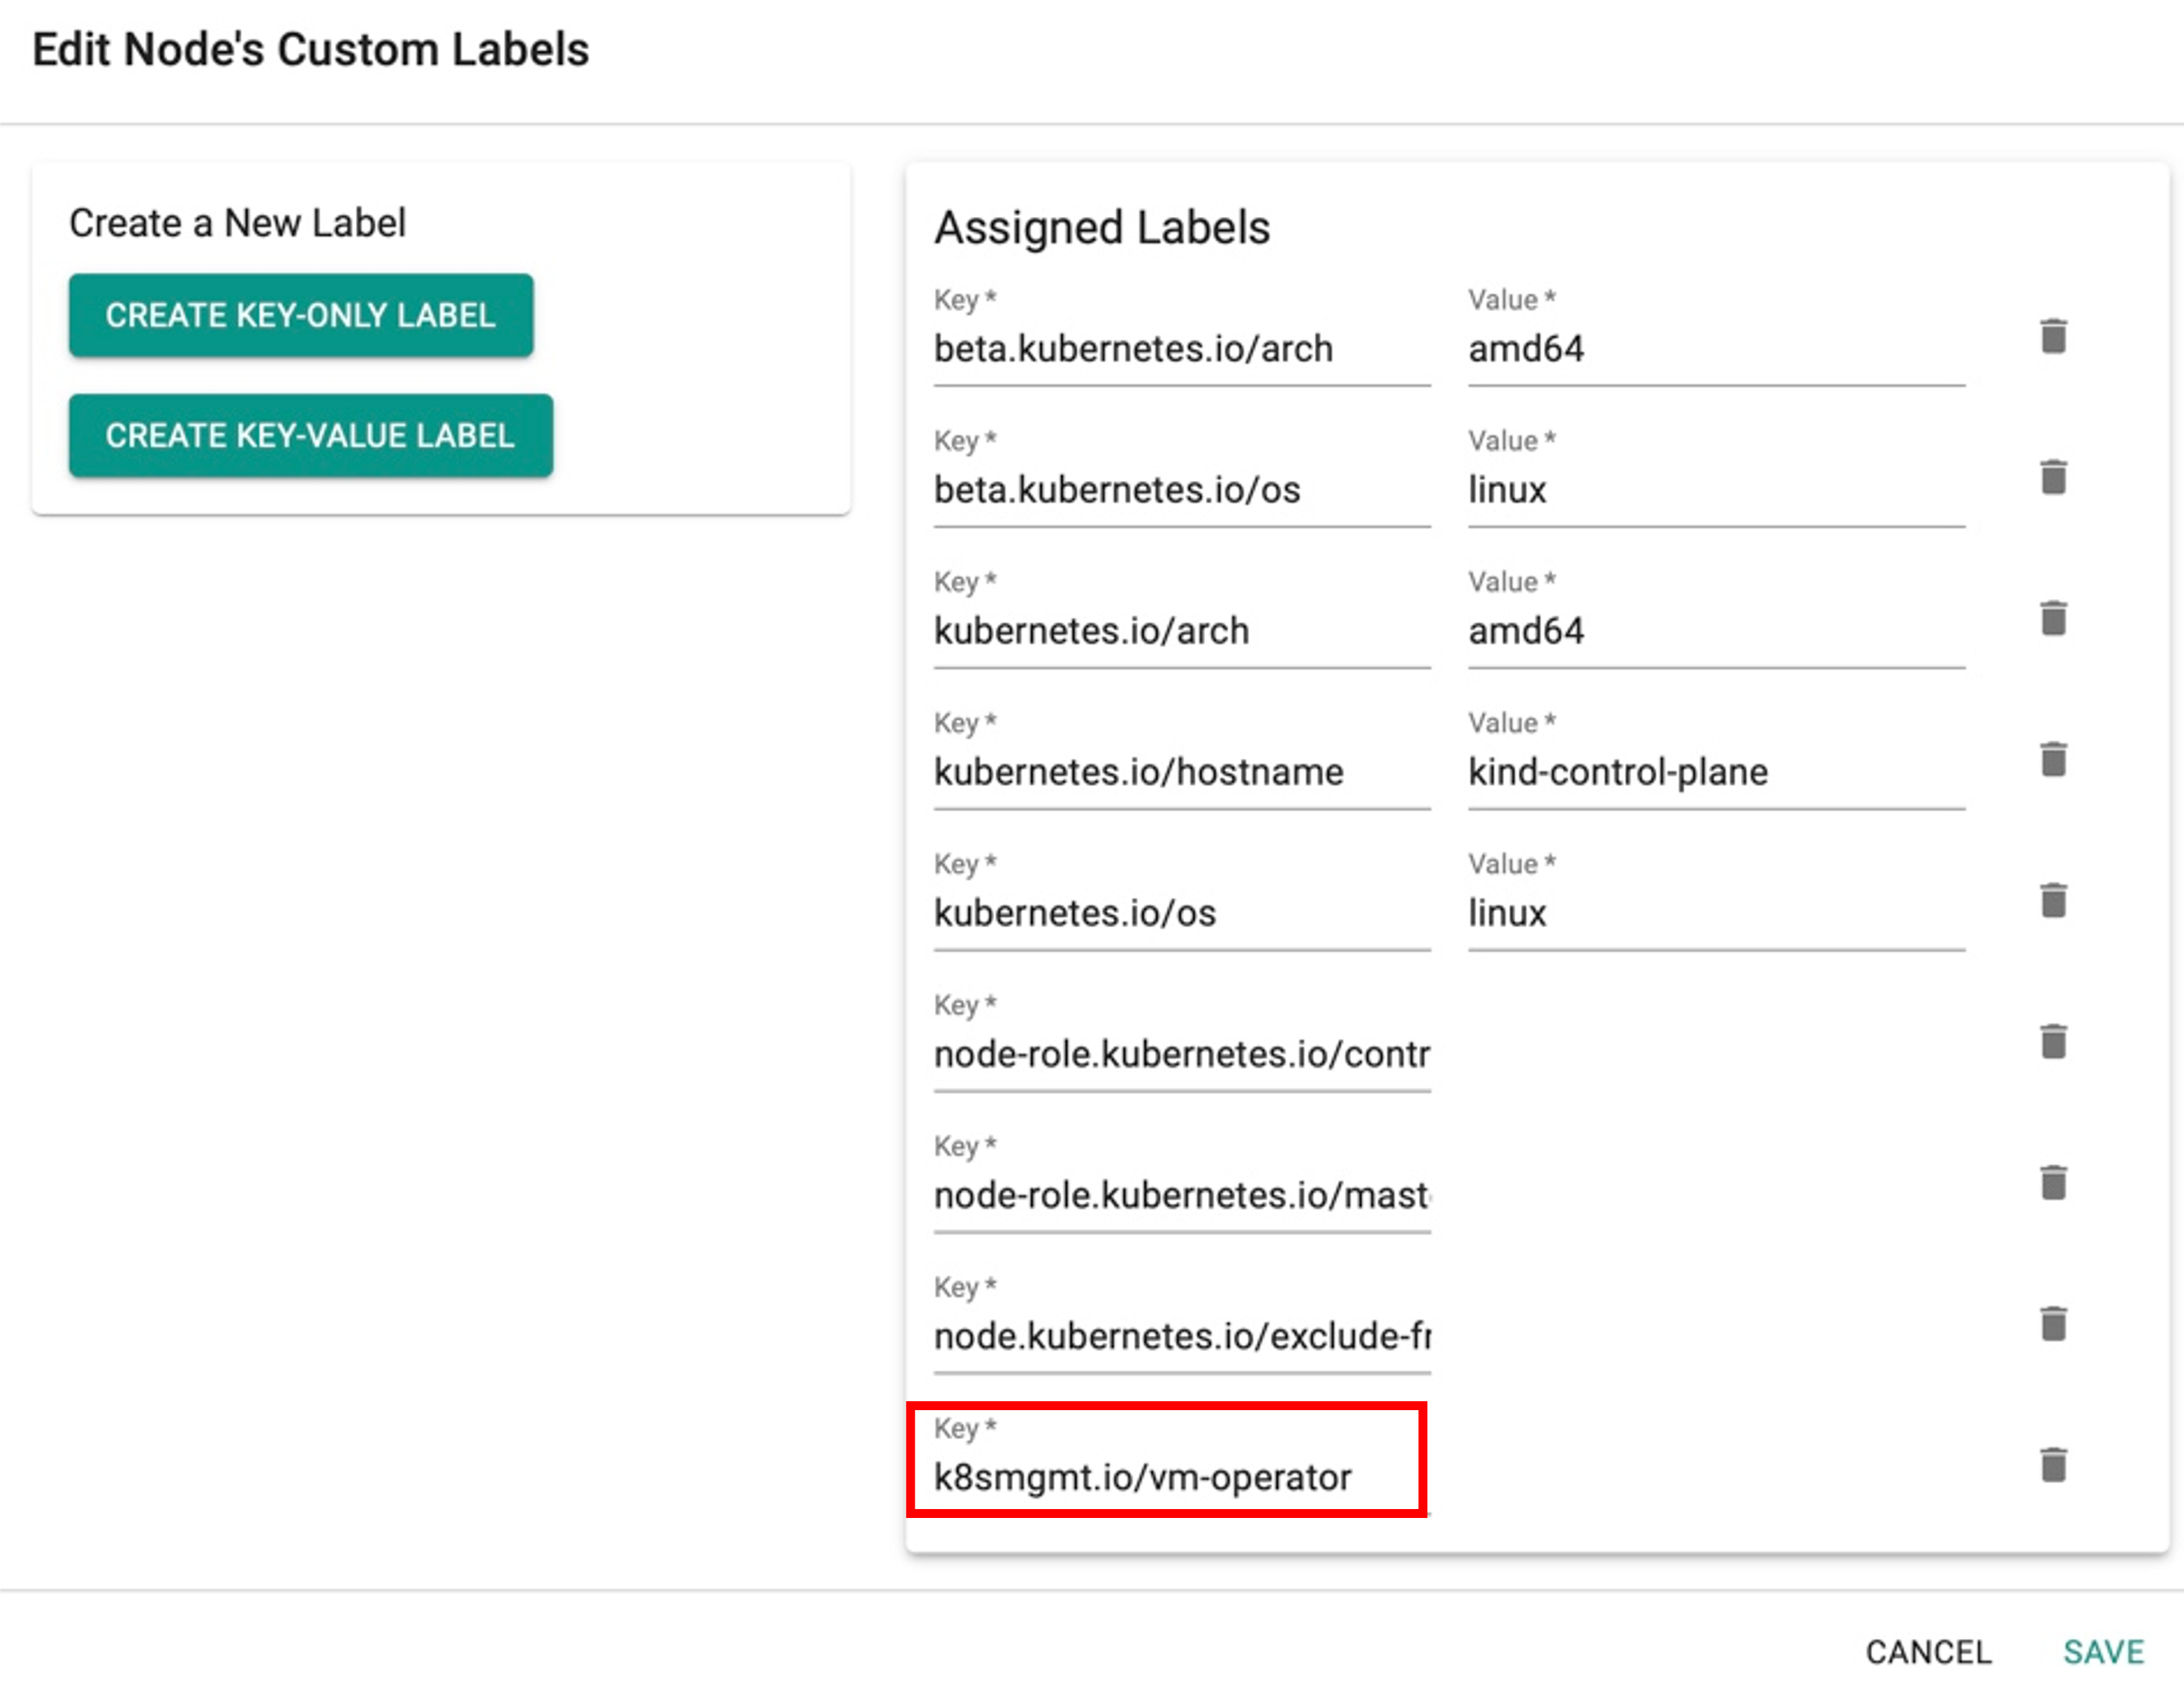
Node Labels
To add or edit more labels, click Edit Labels. For VM workloads, it is mandatory to add a specific key-only label k8smgmt.io/vm-operator and click Save. This specific label deploys all the components of vm-operator to this specific node.
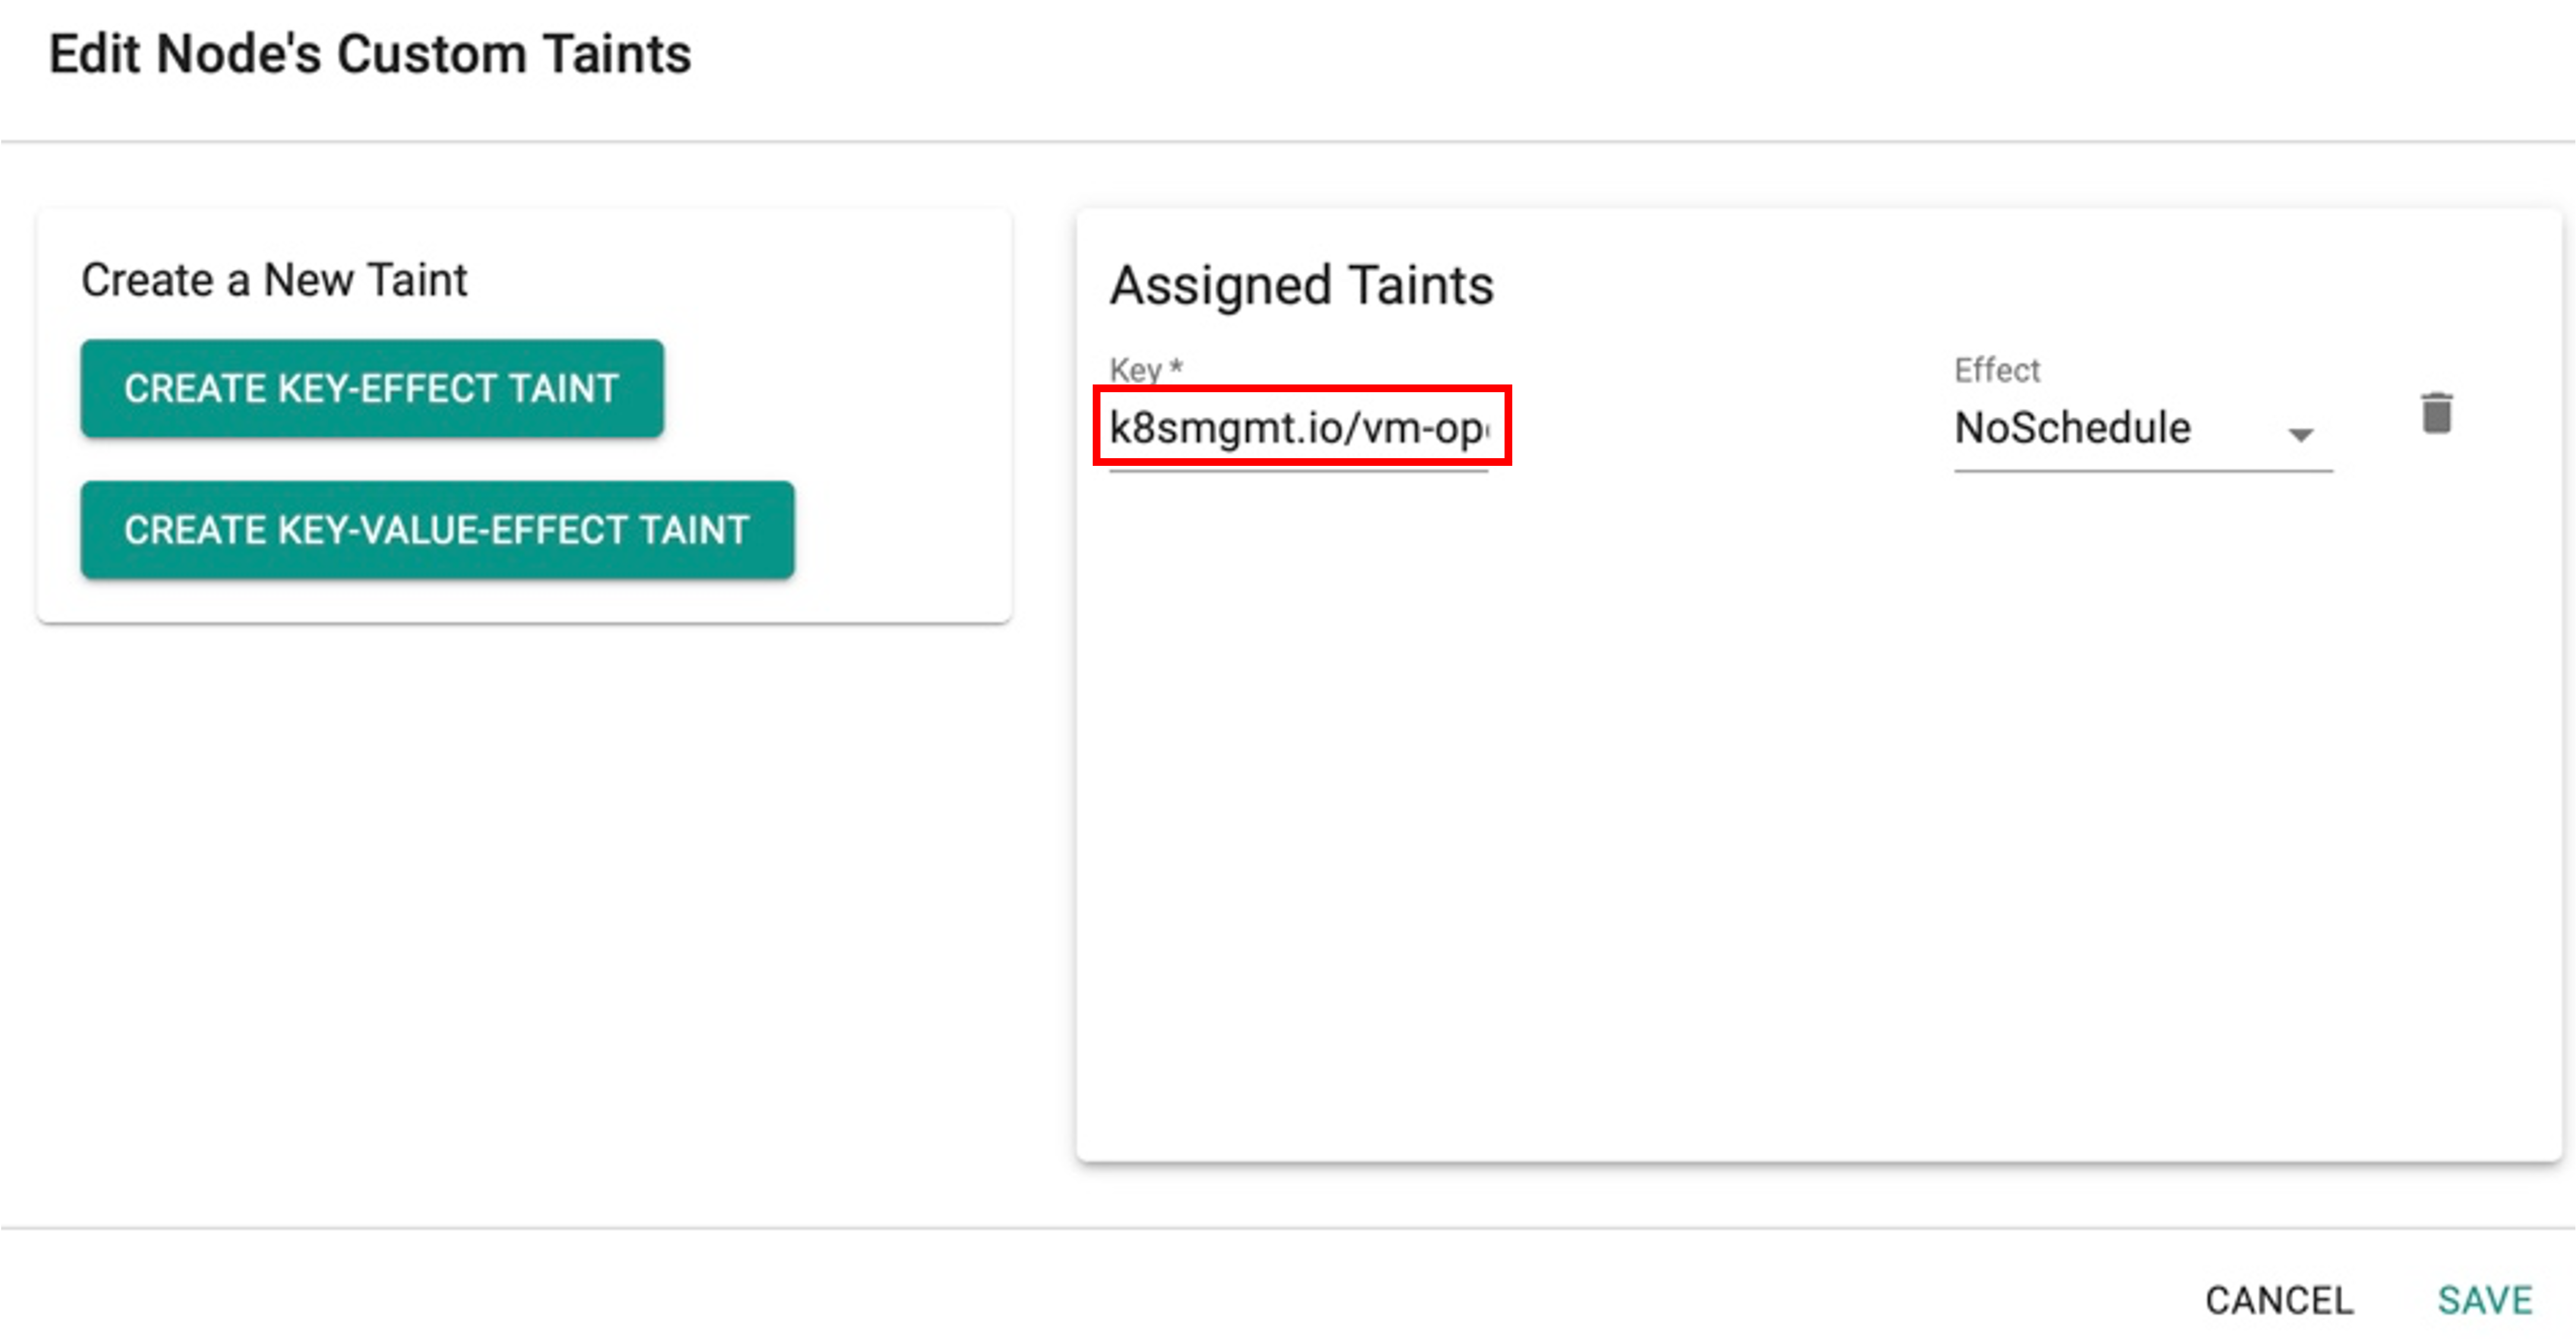
Node Taints (Optional)
To deploy only VM components onto a specific nodes and ignore other components, add Taints with the same key label k8smgmt.io/vm-operator with Effect as NoSchedule and click Save.