Test
In this section, you will try to deploy the following to the cluster.
- OpenTelemetry Instrumentation Resource (To auto instrument the application code without the need to make any code changes)
- A sample application as a workload
We will then verify the traces and metrics on the Jaeger UI.
Step 1: Create Namespace
In this step, you will create a namespace for a sample workload that will be published to the cluster.
apiVersion: infra.k8smgmt.io/v3
kind: Namespace
metadata:
  name: otel-demo
  project: defaultproject
spec:
  placement:
    labels:
    - key: rafay.dev/clusterName
      value: demo-cluster1
- Update the project name and cluster name based on your environment
- Apply the namespace using RCTL as shown below
rctl apply -f otel-demo-ns.yaml
Step 2: Create Workload for OpenTelemetry Instrumentation Resource
In this step, you will create a workload for OpenTelemetry Instrumentation Resource
apiVersion: apps.k8smgmt.io/v3
kind: Workload
metadata:
  name: otel-instrumentation
  project: defaultproject
spec:
  artifact:
    artifact:
      paths:
      - name: file://artifacts/otel-instrumentation/otel-instrumentation.yaml
    type: Yaml
  namespace: otel-demo
  placement:
    selector: rafay.dev/clusterName=demo-cluster1
  version: v1
- In the above spec, update the project and cluster name based on your environment
OpenTelemetry Instrumentation Resource
# should be deployed in the app namespace
apiVersion: opentelemetry.io/v1alpha1
kind: Instrumentation
metadata:
  name: java-instrumentation
spec:
  exporter:
    endpoint: http://simplest-collector.opentelemetry-operator-system.svc.cluster.local:4317
  propagators:
    - tracecontext
    - baggage
    - b3
  sampler:
    type: parentbased_traceidratio
    argument: "0.25"
  java:
    image: ghcr.io/open-telemetry/opentelemetry-operator/autoinstrumentation-java:latest
- Apply the workload spec using RCTL as shown below
rctl apply -f opentelemetry-instrumentation-workload.yaml
Note
OpenTelemetry Instrumentation resource should be applied to the namespace where you will be deploying the application. In this case, I am using otel-demo as the namespace.
Step 3: Create Workload for a Sample application
apiVersion: apps.k8smgmt.io/v3
kind: Workload
metadata:
  name: otel-demo
  project: defaultproject
spec:
  artifact:
    artifact:
      paths:
      - name: file://artifacts/otel-demo/otel-demo.yaml
    type: Yaml
  namespace: otel-demo
  placement:
    selector: rafay.dev/clusterName=demo-cluster1
  version: v1
- In the above spec, update the project and cluster name based on your environment
Application Deployment spec
apiVersion: apps/v1
kind: Deployment
metadata:
 name: otel-demo
spec:
 replicas: 1
 selector:
   matchLabels:
     app: otel-demo
 template:
   metadata:
     labels:
       app: otel-demo
     annotations:
       instrumentation.opentelemetry.io/inject-java: "true"
   spec:
     containers:
     - name: spring
       image: rafaysystems/petclinic:v1
       ports:
       - containerPort: 8080
---
apiVersion: v1
kind: Service
metadata:
  labels:
    app: otel-demo
  name: otel-demo
spec:
  ports:
  - port: 8080
    protocol: TCP
    targetPort: 8080
    name: web
  selector:
    app: otel-demo
rctl apply -f opentelemetry-demo-workload.yaml
Once the workload is deployed, you should see an init container that is injected by OpenTelemetry for instrumentation purpose.
Init Containers:
  opentelemetry-auto-instrumentation:
    Container ID:  containerd://dac69e7131121fbd9bc4a1dfb618384ad70e524de65188f6fc15c4b4ffbad4f2
    Image:         ghcr.io/open-telemetry/opentelemetry-operator/autoinstrumentation-java:latest
    Image ID:      ghcr.io/open-telemetry/opentelemetry-operator/autoinstrumentation-java@sha256:fb4d8cf6f984ed80ccc3865ceb65e94c4c565003b550d08010e13d8fe1e82c3e
    Port:          <none>
    Host Port:     <none>
    Command:
      cp
      /javaagent.jar
      /otel-auto-instrumentation/javaagent.jar
    State:          Terminated
      Reason:       Completed
      Exit Code:    0
      Started:      Sat, 01 Jul 2023 04:24:59 +0000
      Finished:     Sat, 01 Jul 2023 04:24:59 +0000
    Ready:          True
    Restart Count:  0
    Limits:
      cpu:     500m
      memory:  64Mi
    Requests:
      cpu:        50m
      memory:     64Mi
    Environment:  <none>
    Mounts:
      /otel-auto-instrumentation from opentelemetry-auto-instrumentation (rw)
      /var/run/secrets/kubernetes.io/serviceaccount from kube-api-access-dtszz (ro)
Containers:
  spring:
    Container ID:   containerd://1c732cbbe891a8c05998066e82cb6ccb94e295f9867090cd79dfde0b27489703
    Image:          rafaysystems/petclinic:v1
    Image ID:       docker.io/rafaysystems/petclinic@sha256:83954b8b893bc010071ffc82db60262dd4b8d1b410f29174abf0926e7c27de4e
    Port:           8080/TCP
    Host Port:      0/TCP
    State:          Running
      Started:      Sat, 01 Jul 2023 04:25:07 +0000
    Ready:          True
    Restart Count:  0
    Environment:
      JAVA_TOOL_OPTIONS:                    -javaagent:/otel-auto-instrumentation/javaagent.jar
      OTEL_SERVICE_NAME:                   otel-demo
      OTEL_EXPORTER_OTLP_ENDPOINT:         http://simplest-collector.opentelemetry-operator-system.svc.cluster.local:4317
      OTEL_RESOURCE_ATTRIBUTES_POD_NAME:   otel-demo-b898b9cc9-67fwp (v1:metadata.name)
      OTEL_RESOURCE_ATTRIBUTES_NODE_NAME:   (v1:spec.nodeName)
      OTEL_PROPAGATORS:                    tracecontext,baggage,b3
      OTEL_TRACES_SAMPLER:                 parentbased_traceidratio
      OTEL_TRACES_SAMPLER_ARG:             0.25
      OTEL_RESOURCE_ATTRIBUTES:            k8s.container.name=spring,k8s.deployment.name=otel-demo,k8s.namespace.name=otel-demo,k8s.node.name=$(OTEL_RESOURCE_ATTRIBUTES_NODE_NAME),k8s.pod.name=$(OTEL_RESOURCE_ATTRIBUTES_POD_NAME),k8s.replicaset.name=otel-demo-b898b9cc9
Step 4: Access the Application
Since we did not expose the application, we will do port-forward and use curl to access the app.
kubectl port-forward service/otel-demo -n otel-demo 8080:8080
Below bash script will be used to access the application which will generate traces and metrics.
while true;
do
  curl http://localhost:8080/
  curl http://localhost:8080/owners/find
  curl http://localhost:8080/owners?lastName=
  curl http://localhost:8080/vets.html
  curl http://localhost:8080/oups
  curl http://localhost:8080/oups
  sleep 0.01
done
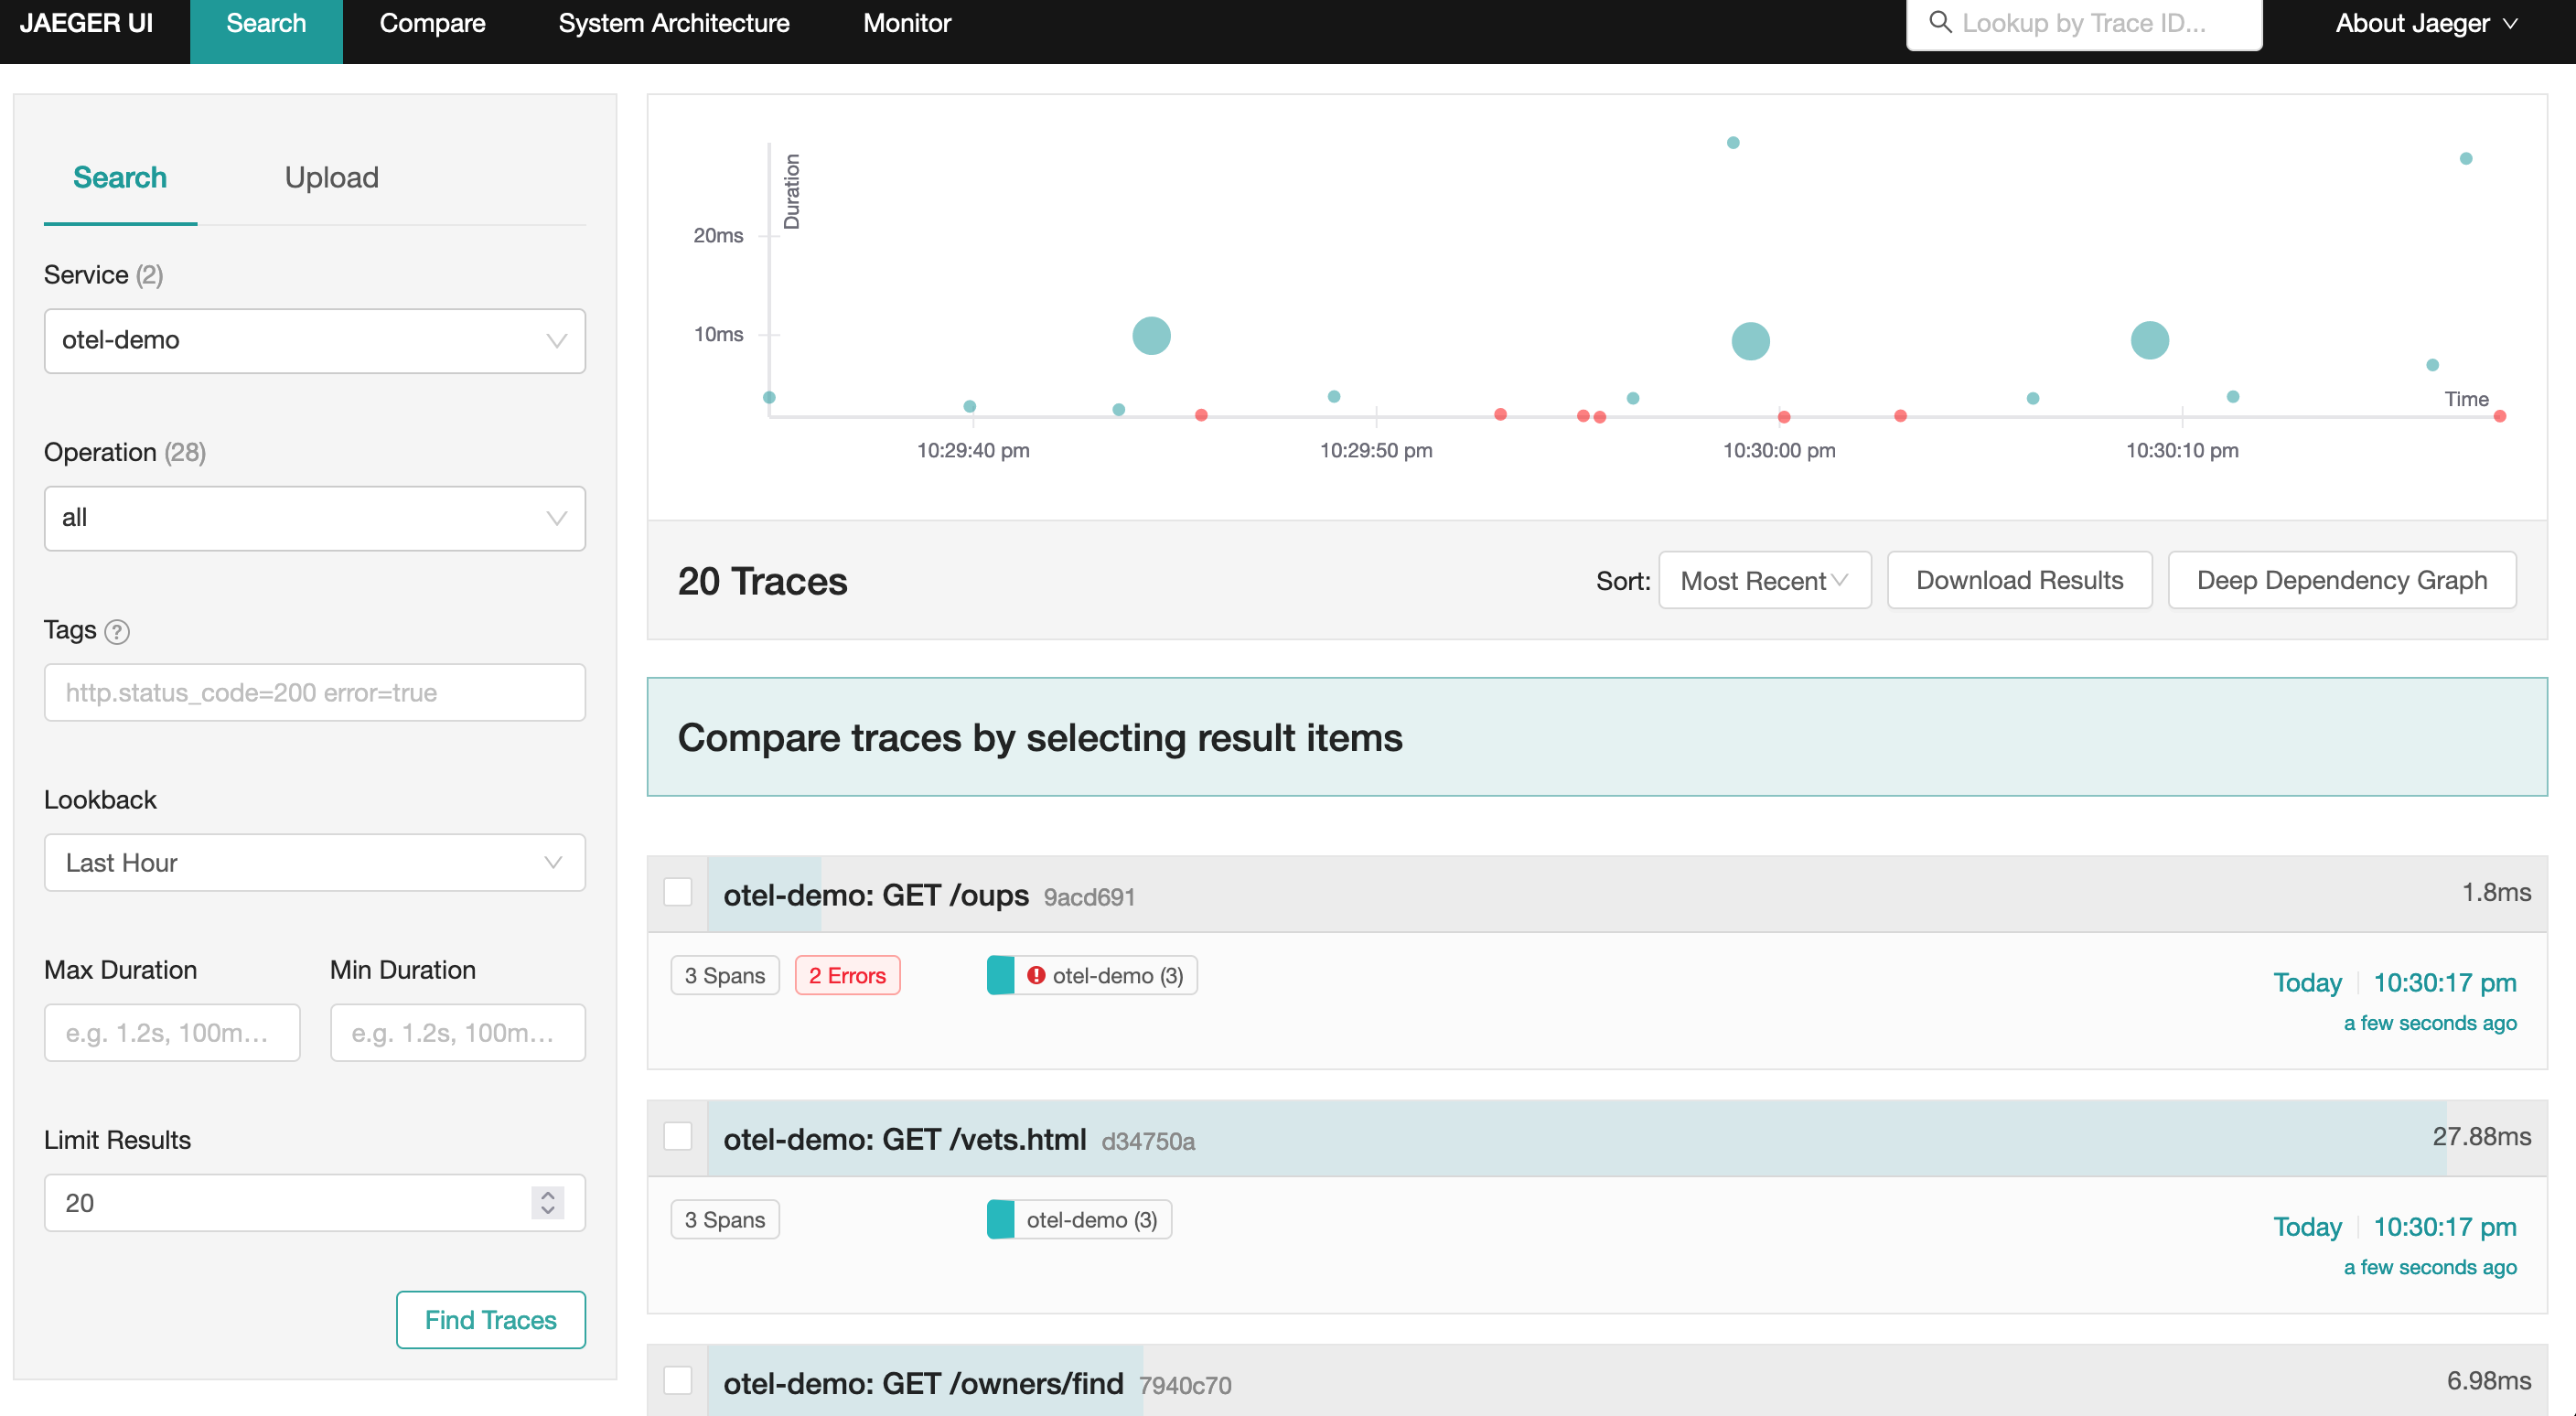
Step 5: Accessing Jaeger UI
Open your browser and type the hostname that you used as ingress for Jaeger.
Traces
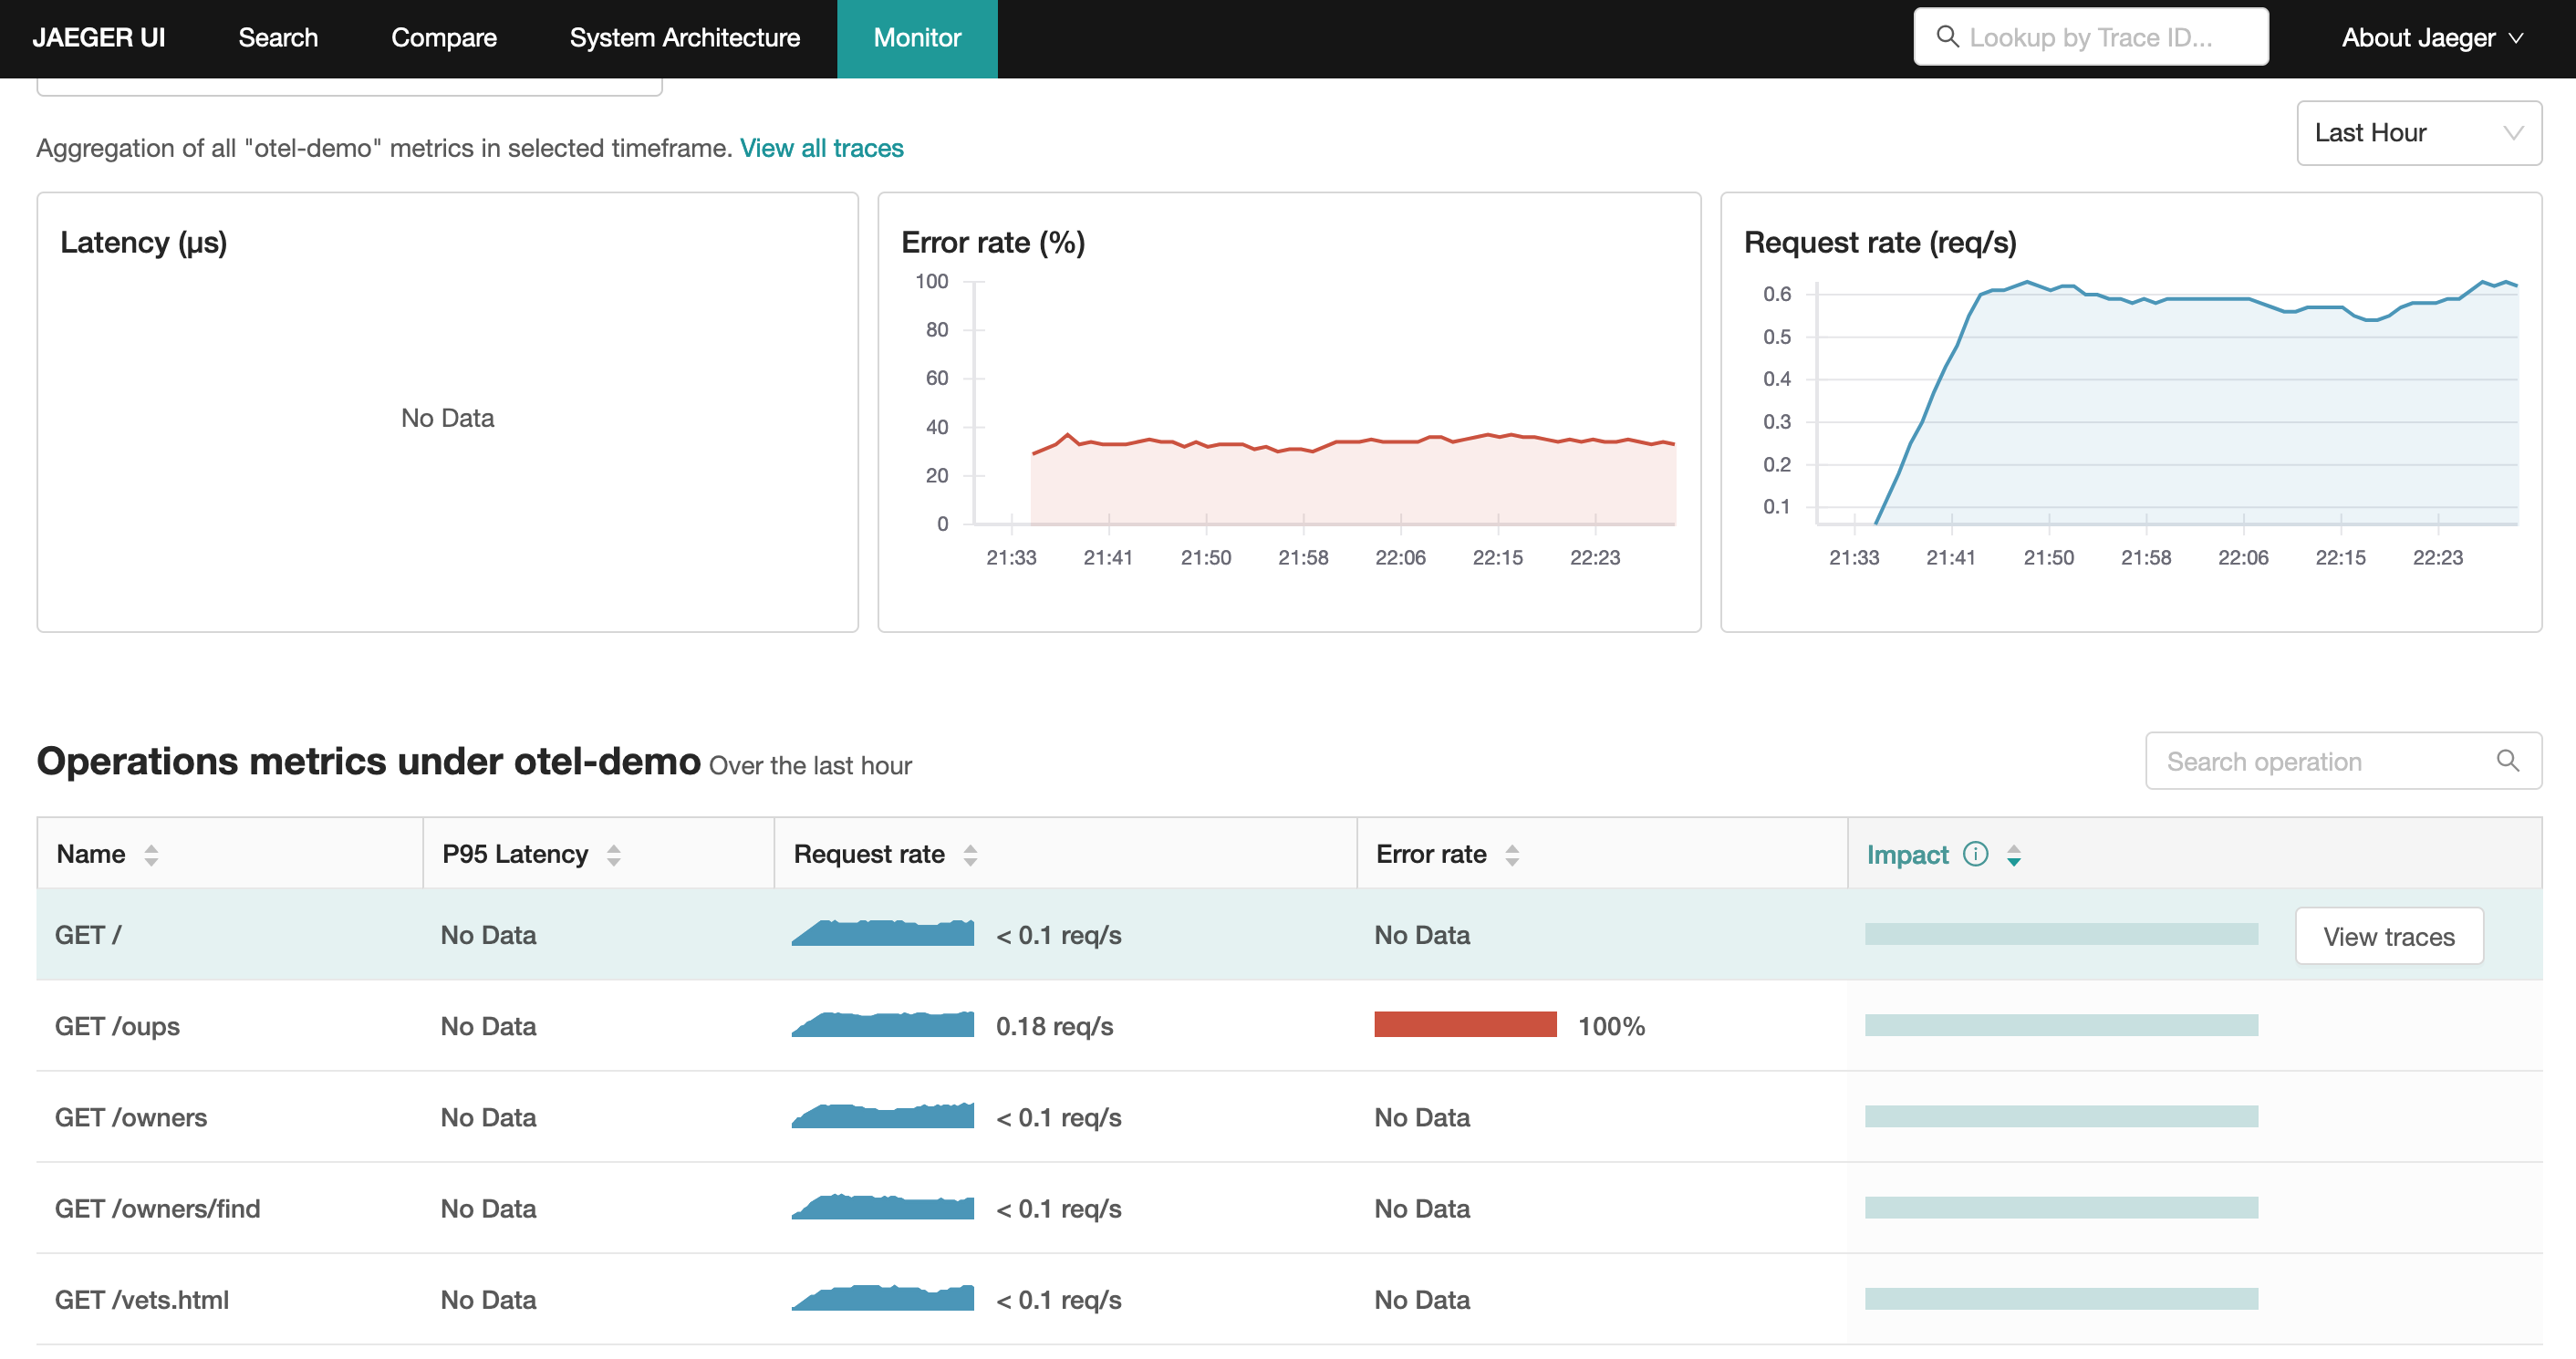
Metrics
Recap
Congratulations! You have successfully deployed OpenTelemetry components on your managed Kubernetes cluster as custom add-ons in a custom cluster blueprint.