Network Visibility (EOL)
Important
Network Policy Dashboard is currently deprecated and will be removed in a future release
Introduction
In addition to the ability to configure network policies, it is important to also be able to see how those network policies are being enforced across your cluster, namespaces, and applications. For example, for namespace isolation, you likely would want to see if traffic that is initiated from one namespace to another is being blocked.
Network Policy Dashboard provides visibility into your traffic flows across your K8s infrastructure.
Use cases
- Validating namespace isolation: As an admin, you can check whether traffic from namespaces that should be isolated (for multi-tenancy or security purposes) is being blocked
- Checking default security posture: If you have default ingress rules across the cluster that controls flow of traffic from the internet, you can use the dashboard to make sure that it is in effect. If you see traffic coming from an unknown source, such as anything that is a non API Gateway or Load Balancer, you can act on the information appropriately to validate your network policies
- Troubleshooting applications: If an application is unable to communicate to the entities it needs to, you can check how the traffic flows are initiated and where the communication is failing
- Data Retention to compare and contrast network traffic flows: You can go back in time to check how traffic flows looked like compared to the present. This is especially useful after application or cluster upgrades
RBAC
The following lists the permissions and accessibility for the network policy visibility dashboard.
| Role | Visibility |
|---|---|
| Org Admin/Org Read-Only | Everything |
| Infra Admin/Infra Read-Only | Cluster-wide view for projects that the user has access to |
| Project Admin/Project Read-Only | Namespaces that the user has access to on a per cluster basis |
| Cluster Admin | Cluster-wide view for projects that the user has access to |
| Cluster Template User | NONE |
| Namespace Admin/Namespace Read-Only | Namespaces that the user has access to on a per cluster basis |
| Workspace Admin | Namespaces that the user has access to on a per cluster basis |
Getting to the Dashboards
- Login to the controller and click on dashboards.
- Go to Network Policy
- Use the appropriate filters to filter to the specific project and cluster
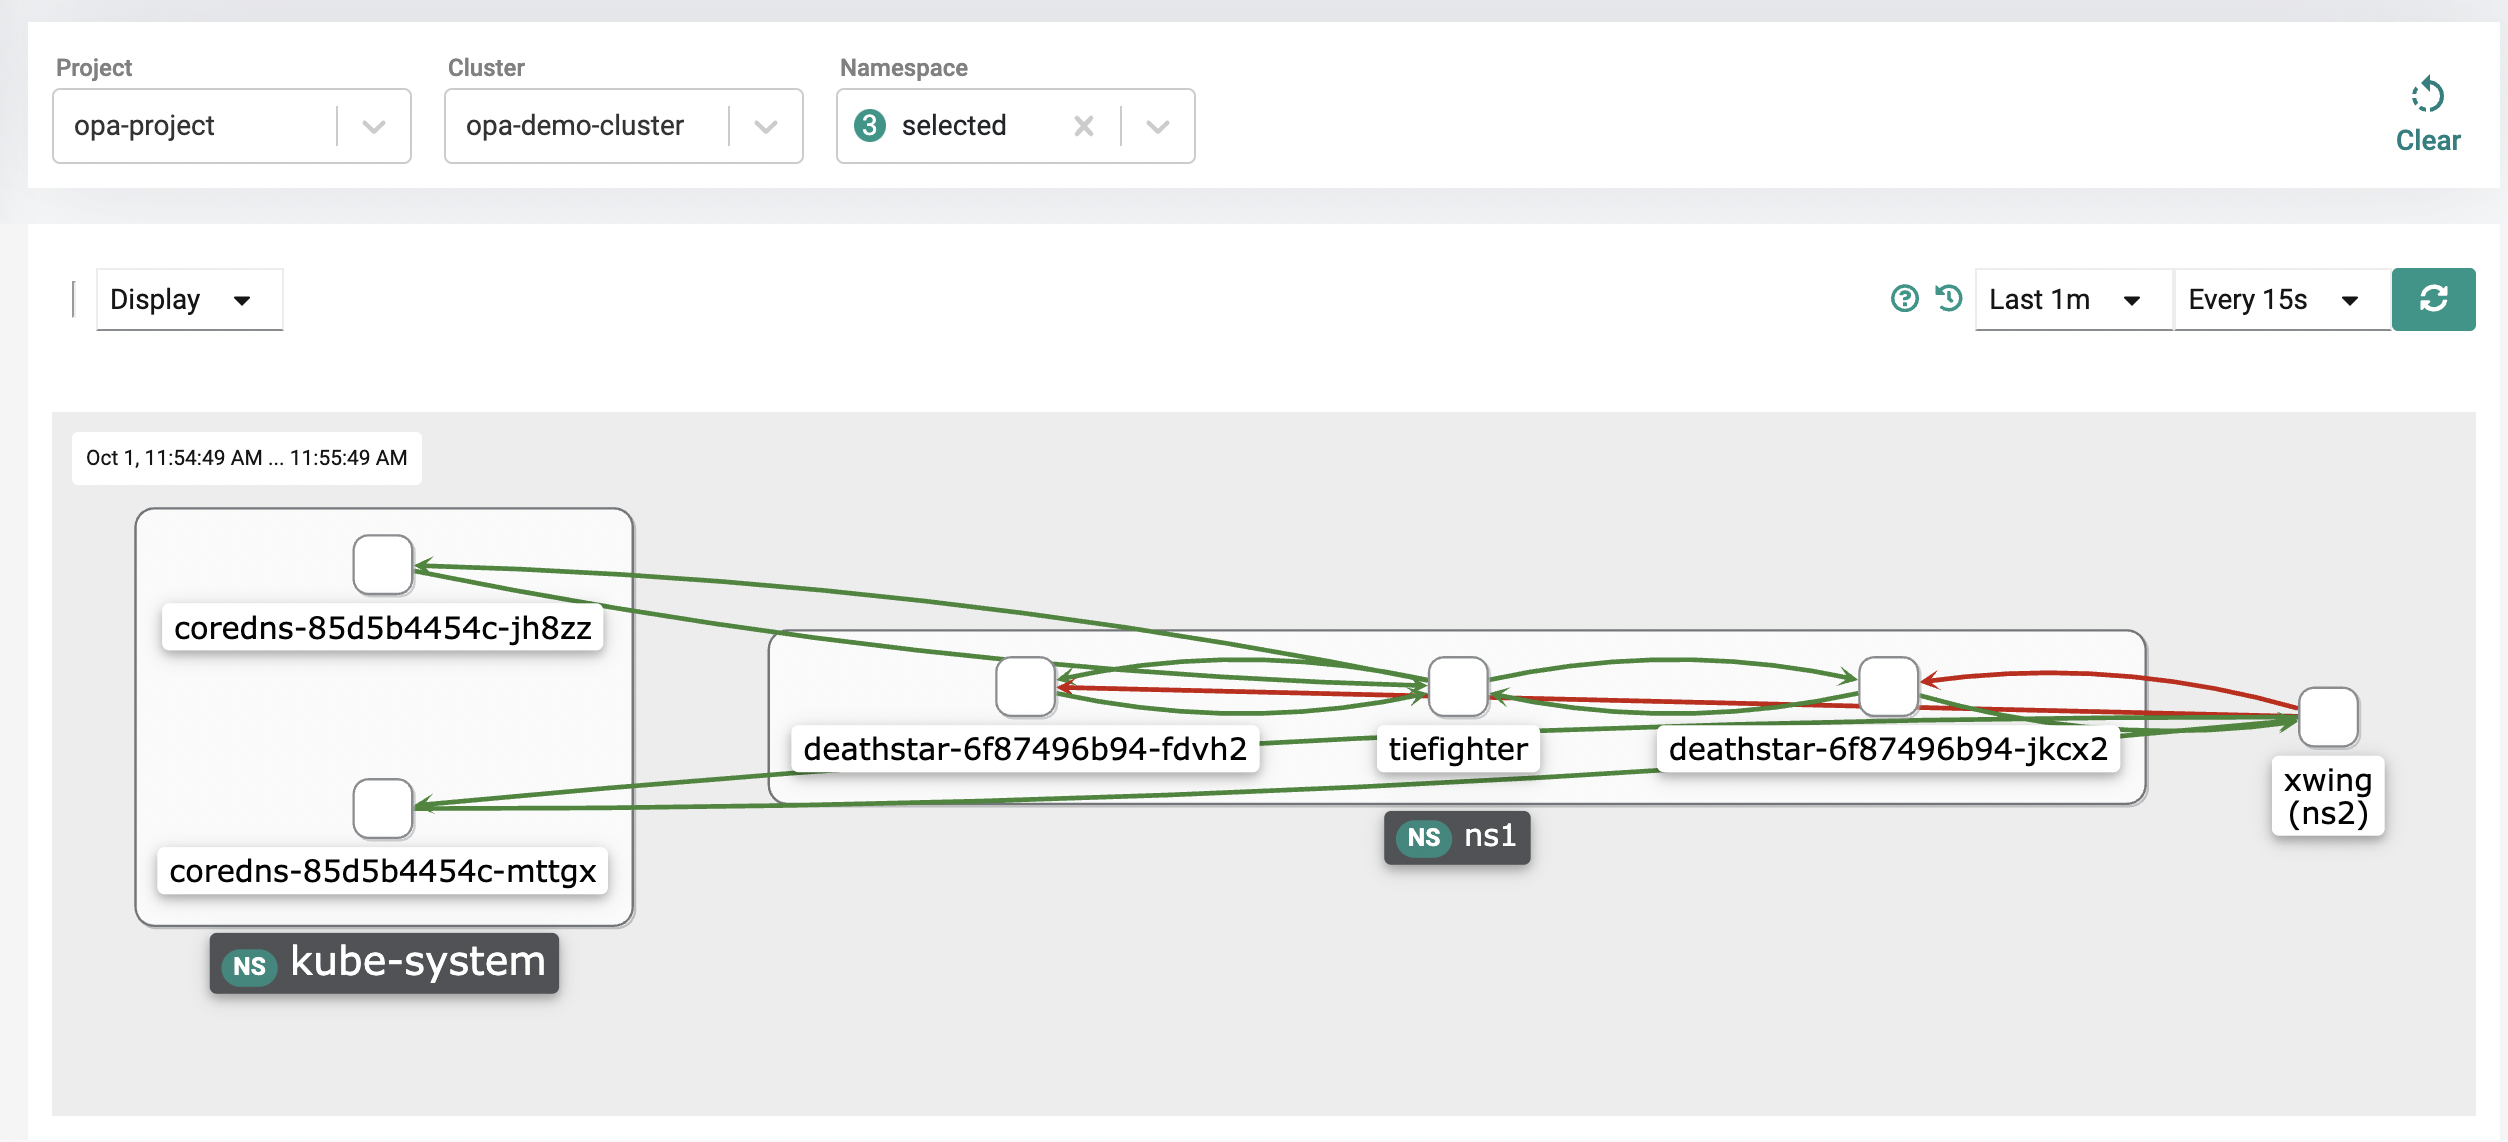
Namespaces are labeled with NS and are the bigger boxes with pods contained in them.
Namespace Filtering
You can filter by namespace if you want to see traffic to/from specific namespaces.
Details on Types of traffic
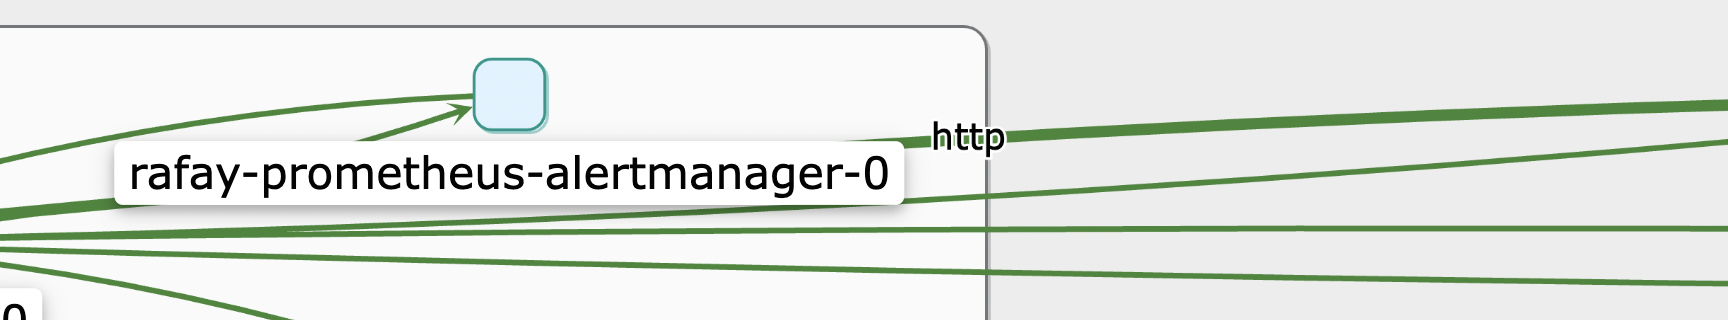
You can click a specific flow in the middle to load the type of traffic the flow is representing. For example, in the picture below, you can see that it is HTTP traffic that is being generated.
Replaying Historical Workflows
7 days worth of historical traffic flows are captured. You can filter traffic for a certain period of time, for example last 1 minute, or last 1 day.
NOTE: The option for 7 days will not appear unless you have 7 days worth of traffic.
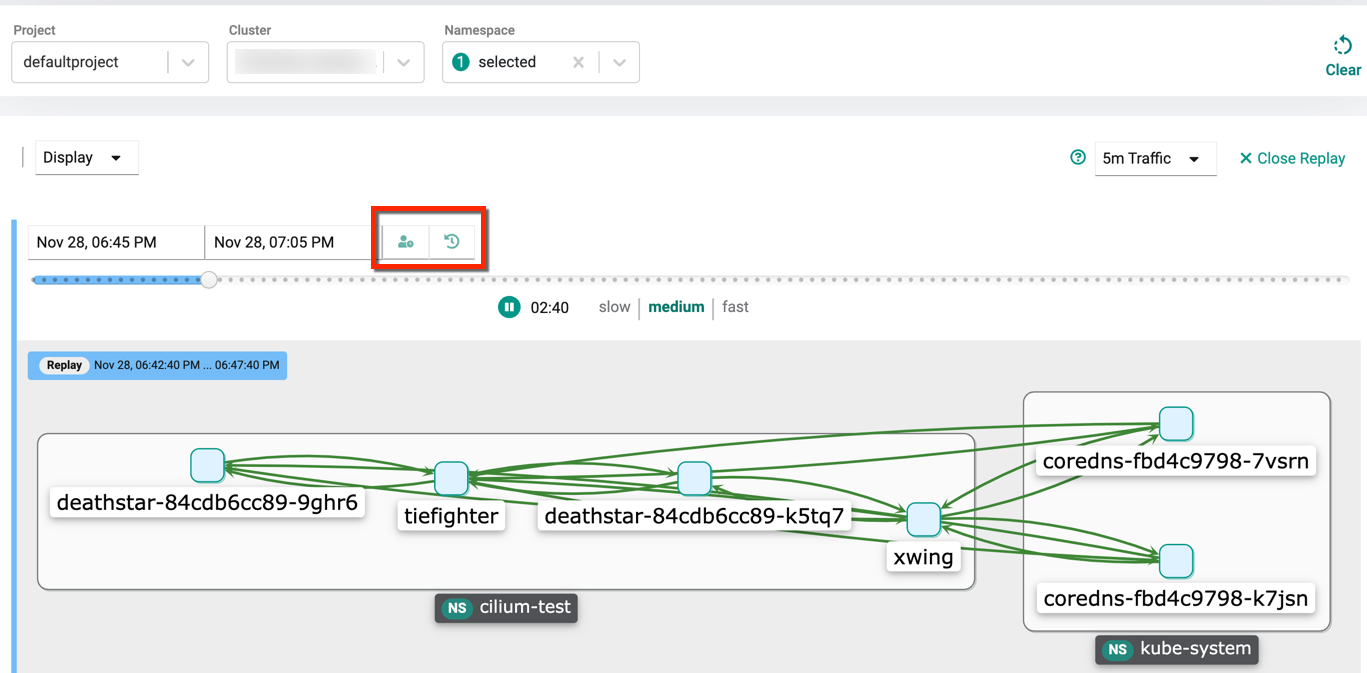
In addition, using the replay button to the left of the dropdown, you can go back and replay traffic patterns over a period of time. Use Set Custom start/end time icon to view the metrics of a specific period. This is extremely useful when debugging applications and seeing at what point things started/stopped working from a network communication point of view and why.
Let's see what options we have to replay traffic.
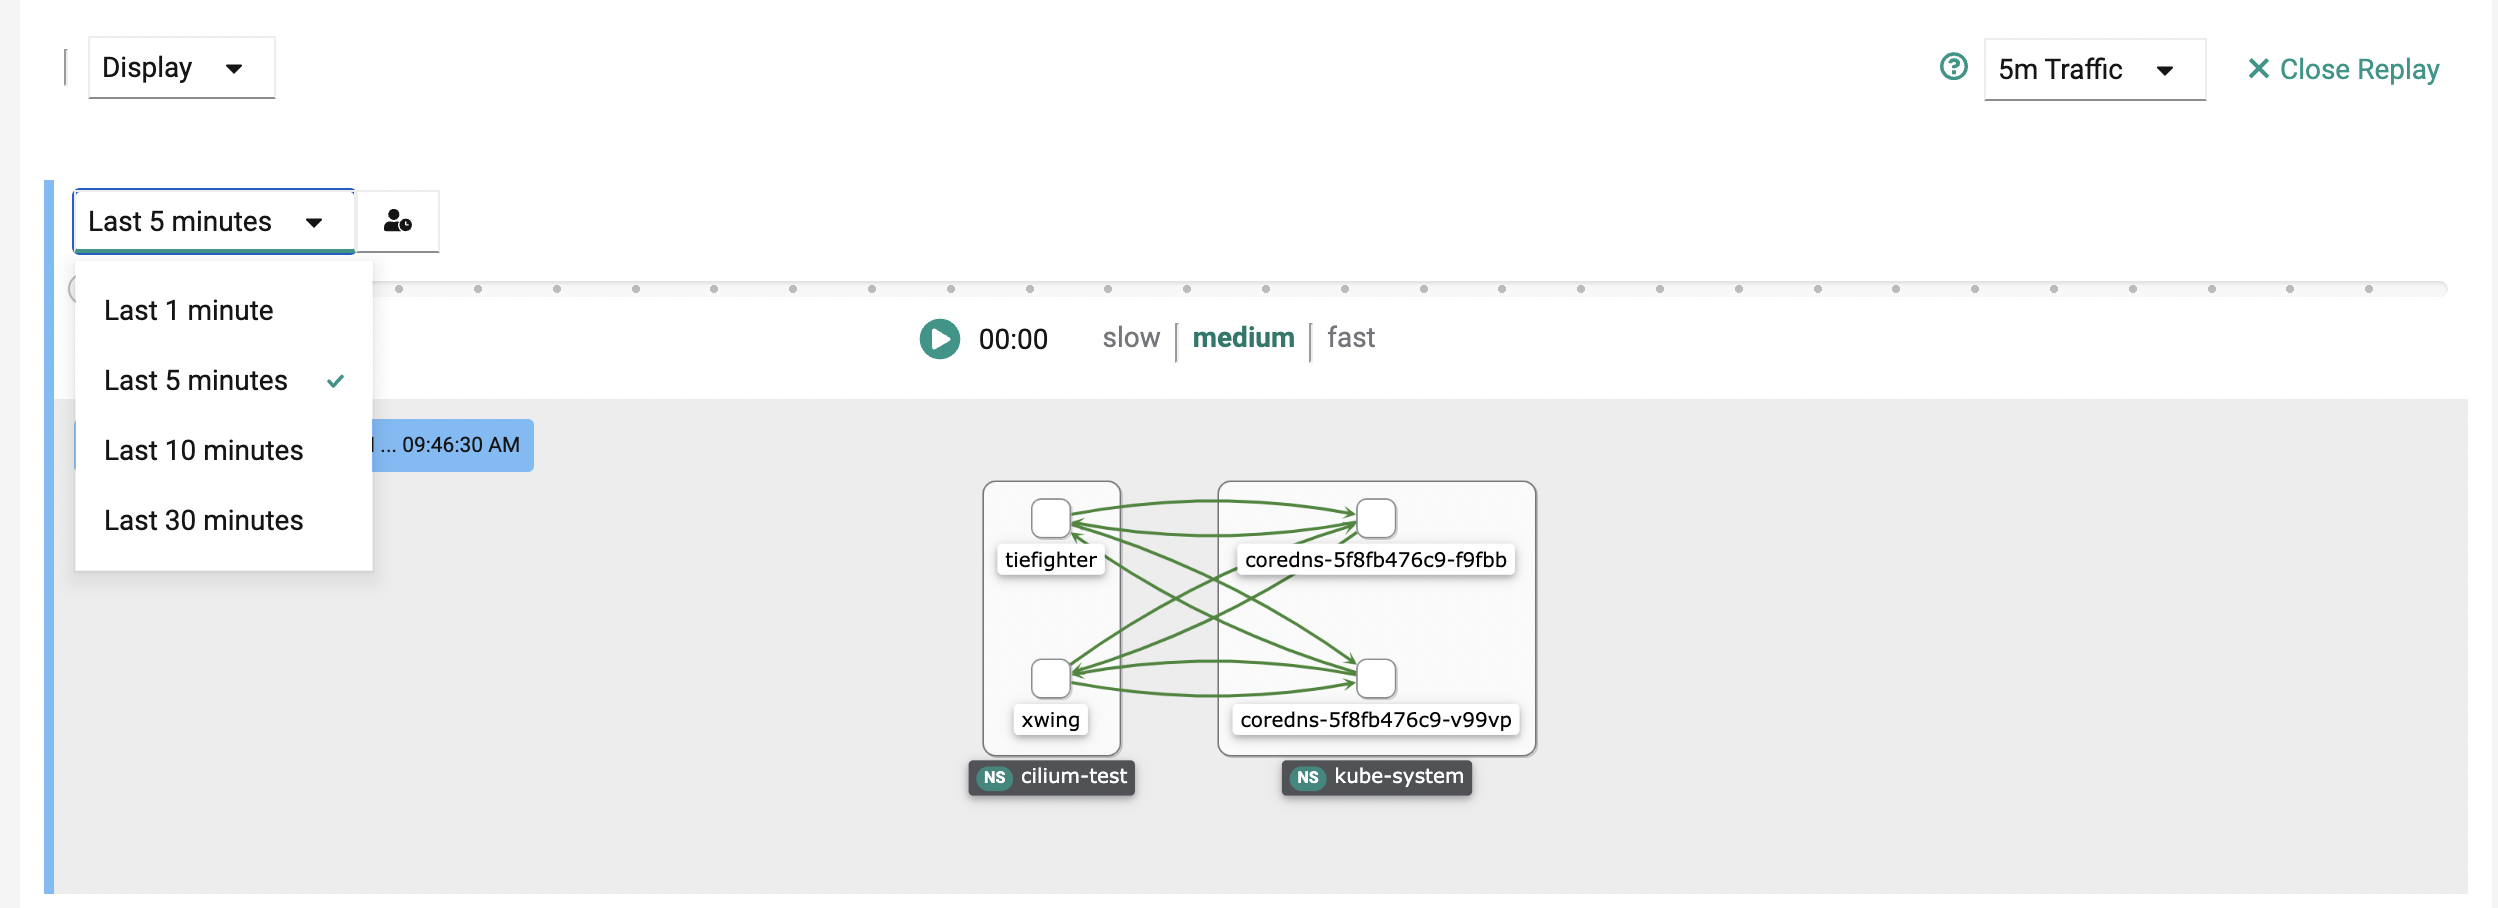
Replaying Recent Events With Fixed Time Intervals
If you want to replay recent event and look over a fixed time interval the dashboard gives the following options:
- last 1 minutes
- last 5 minutes
- last 10 minutes
- last 30 minutes
Replaying Traffic With Custom Start Time and Fixed Time Interval
The dashboard also provides functionality to go back in time and replay over a fixed time interval from a specific start time/date.
In order to this:
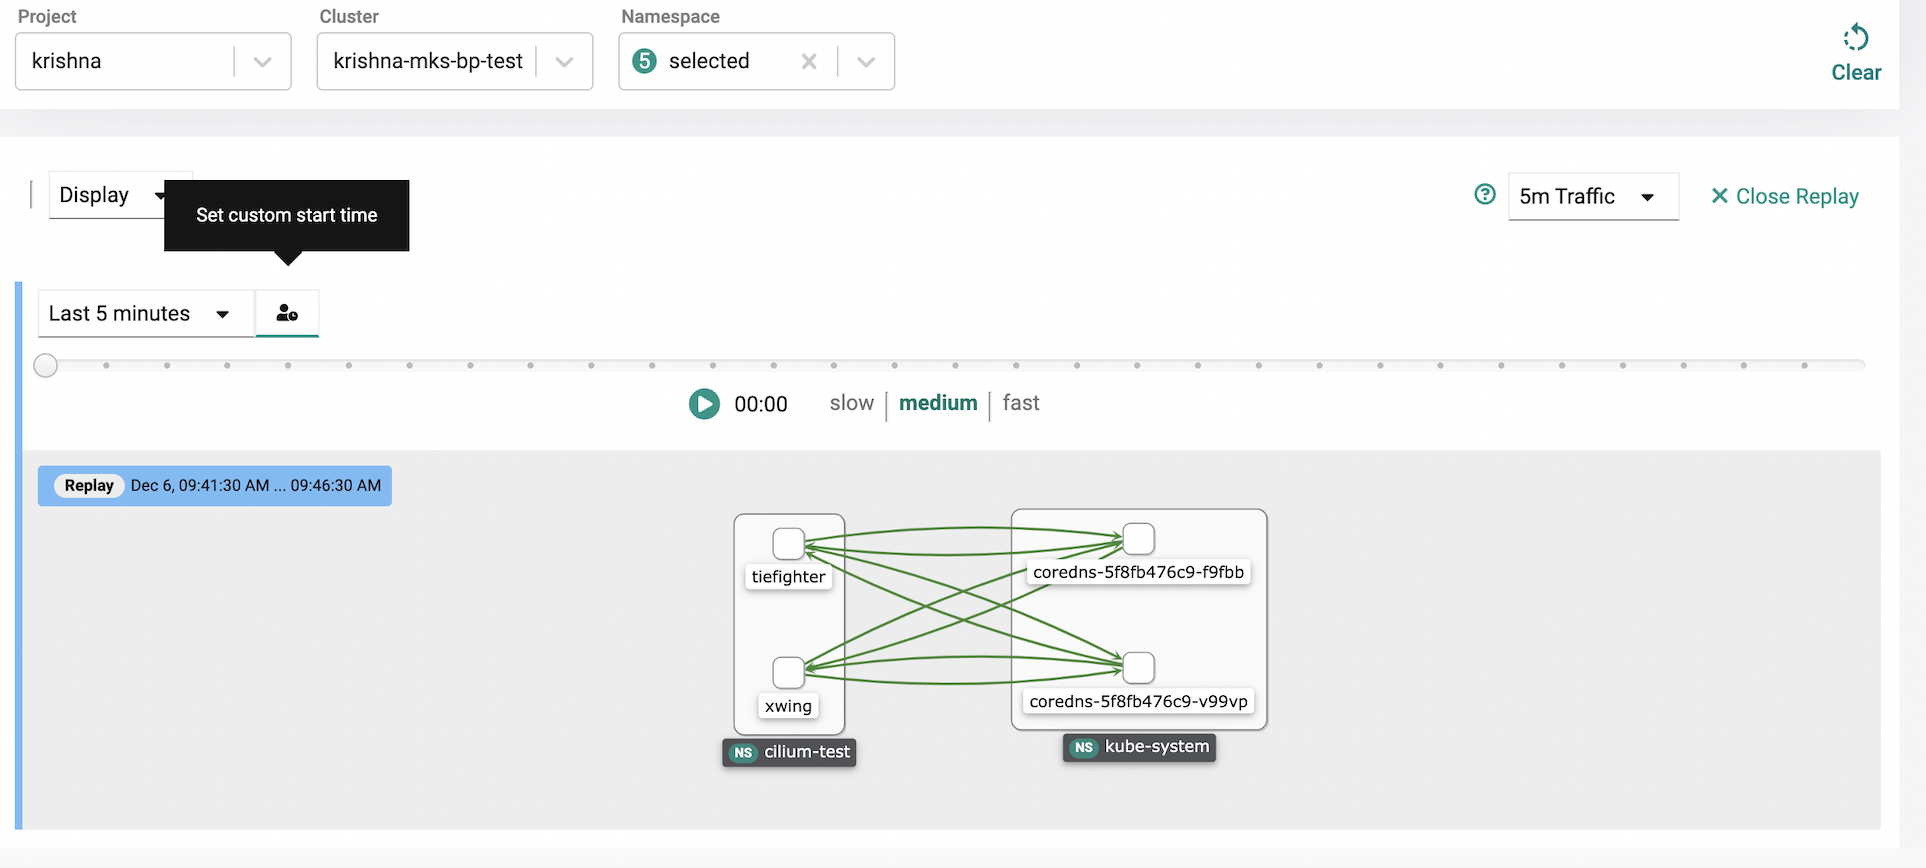
- select set custom start time next to the fixed time interval.
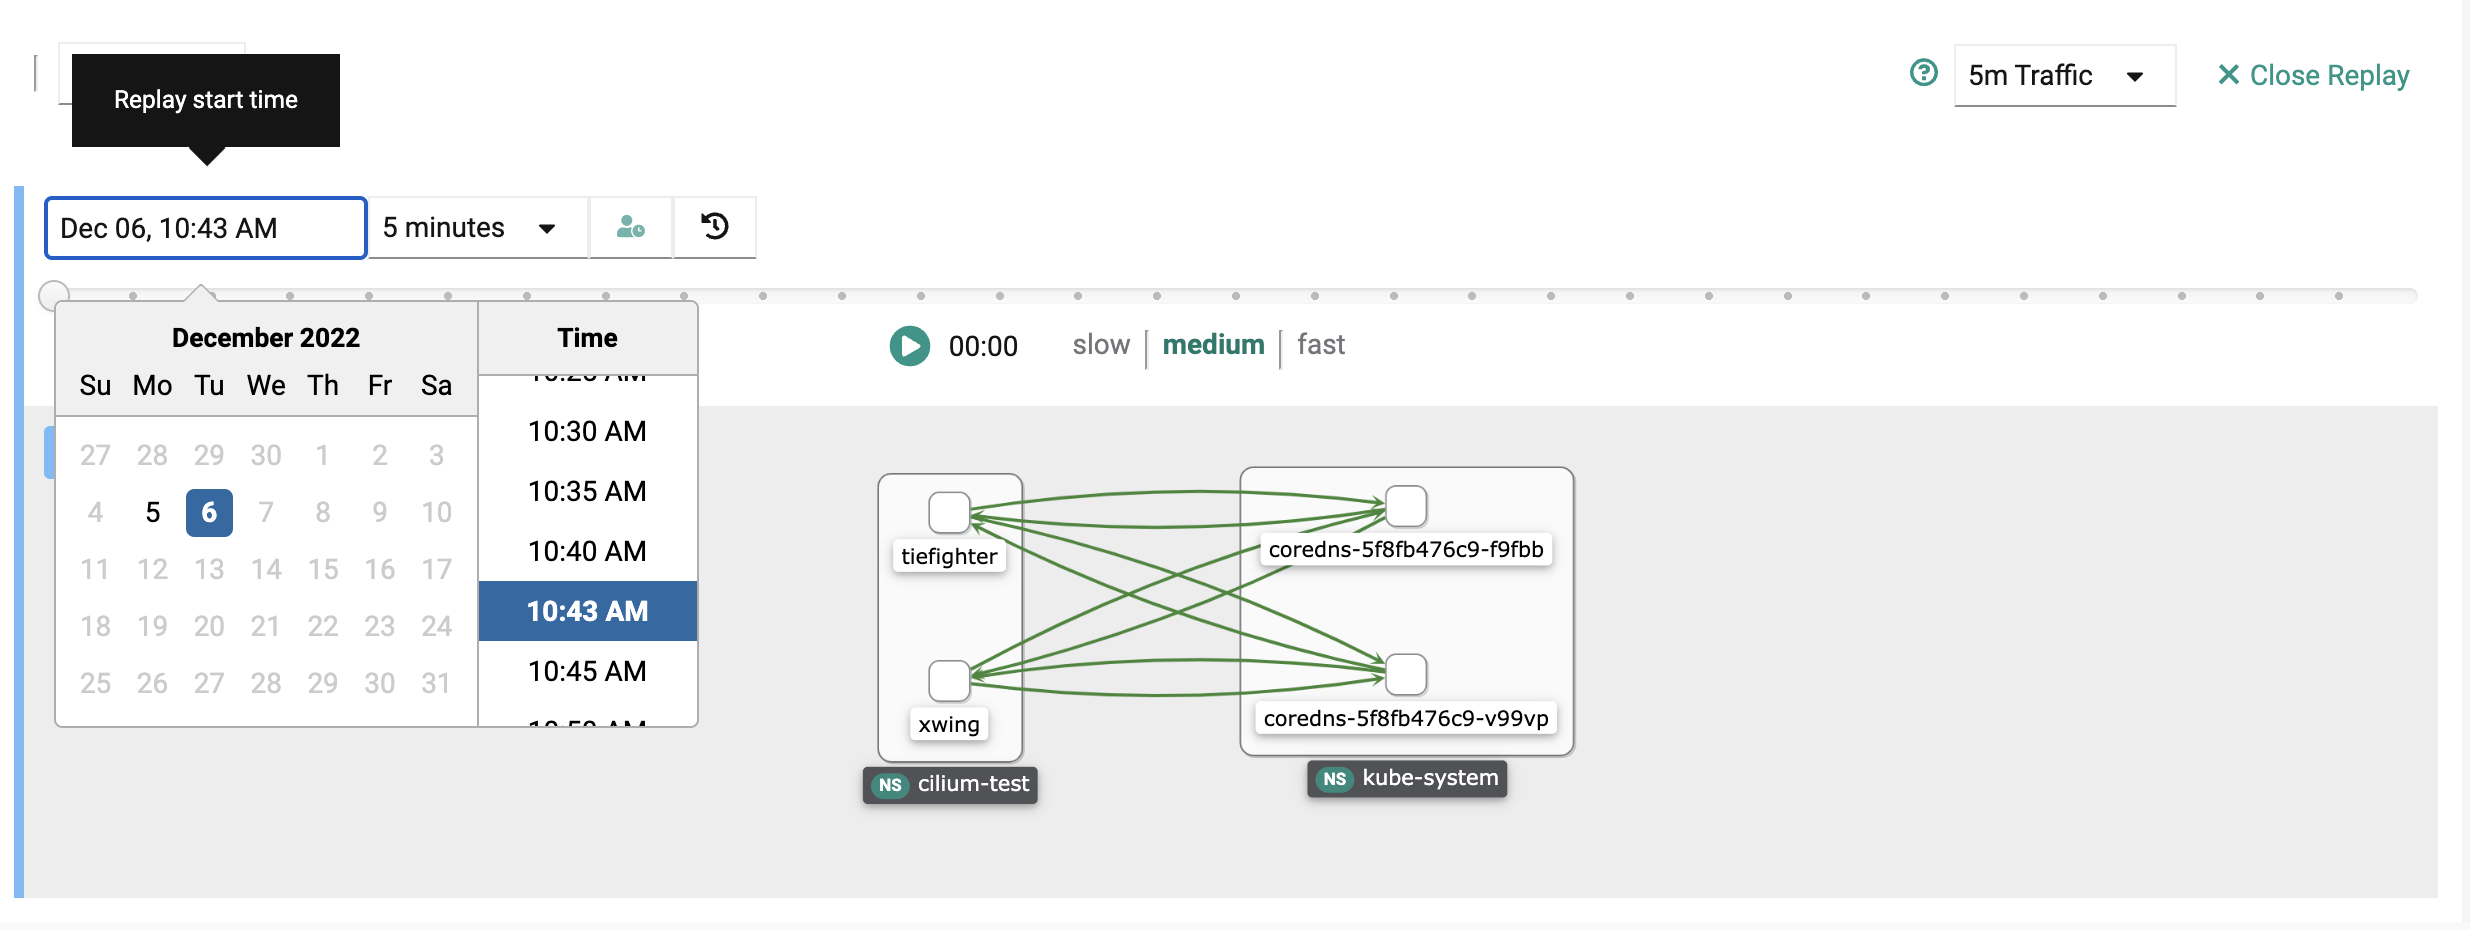
- select the date icon that appears on the left and use the calendar and time slots to select the date and time you want to replay from
- hit the play button to replay
- if you want to go back to the simple replay, click the set simple start time icon next to the fixed time interval dropdown.
Replaying Traffic With Custom Start Time and End Time
If you want to replay traffic over a completely custom time interval, you can do that by setting a custom start time and end time.
In order to do this:
- select set custom start time next to the fixed time interval if you haven't already.
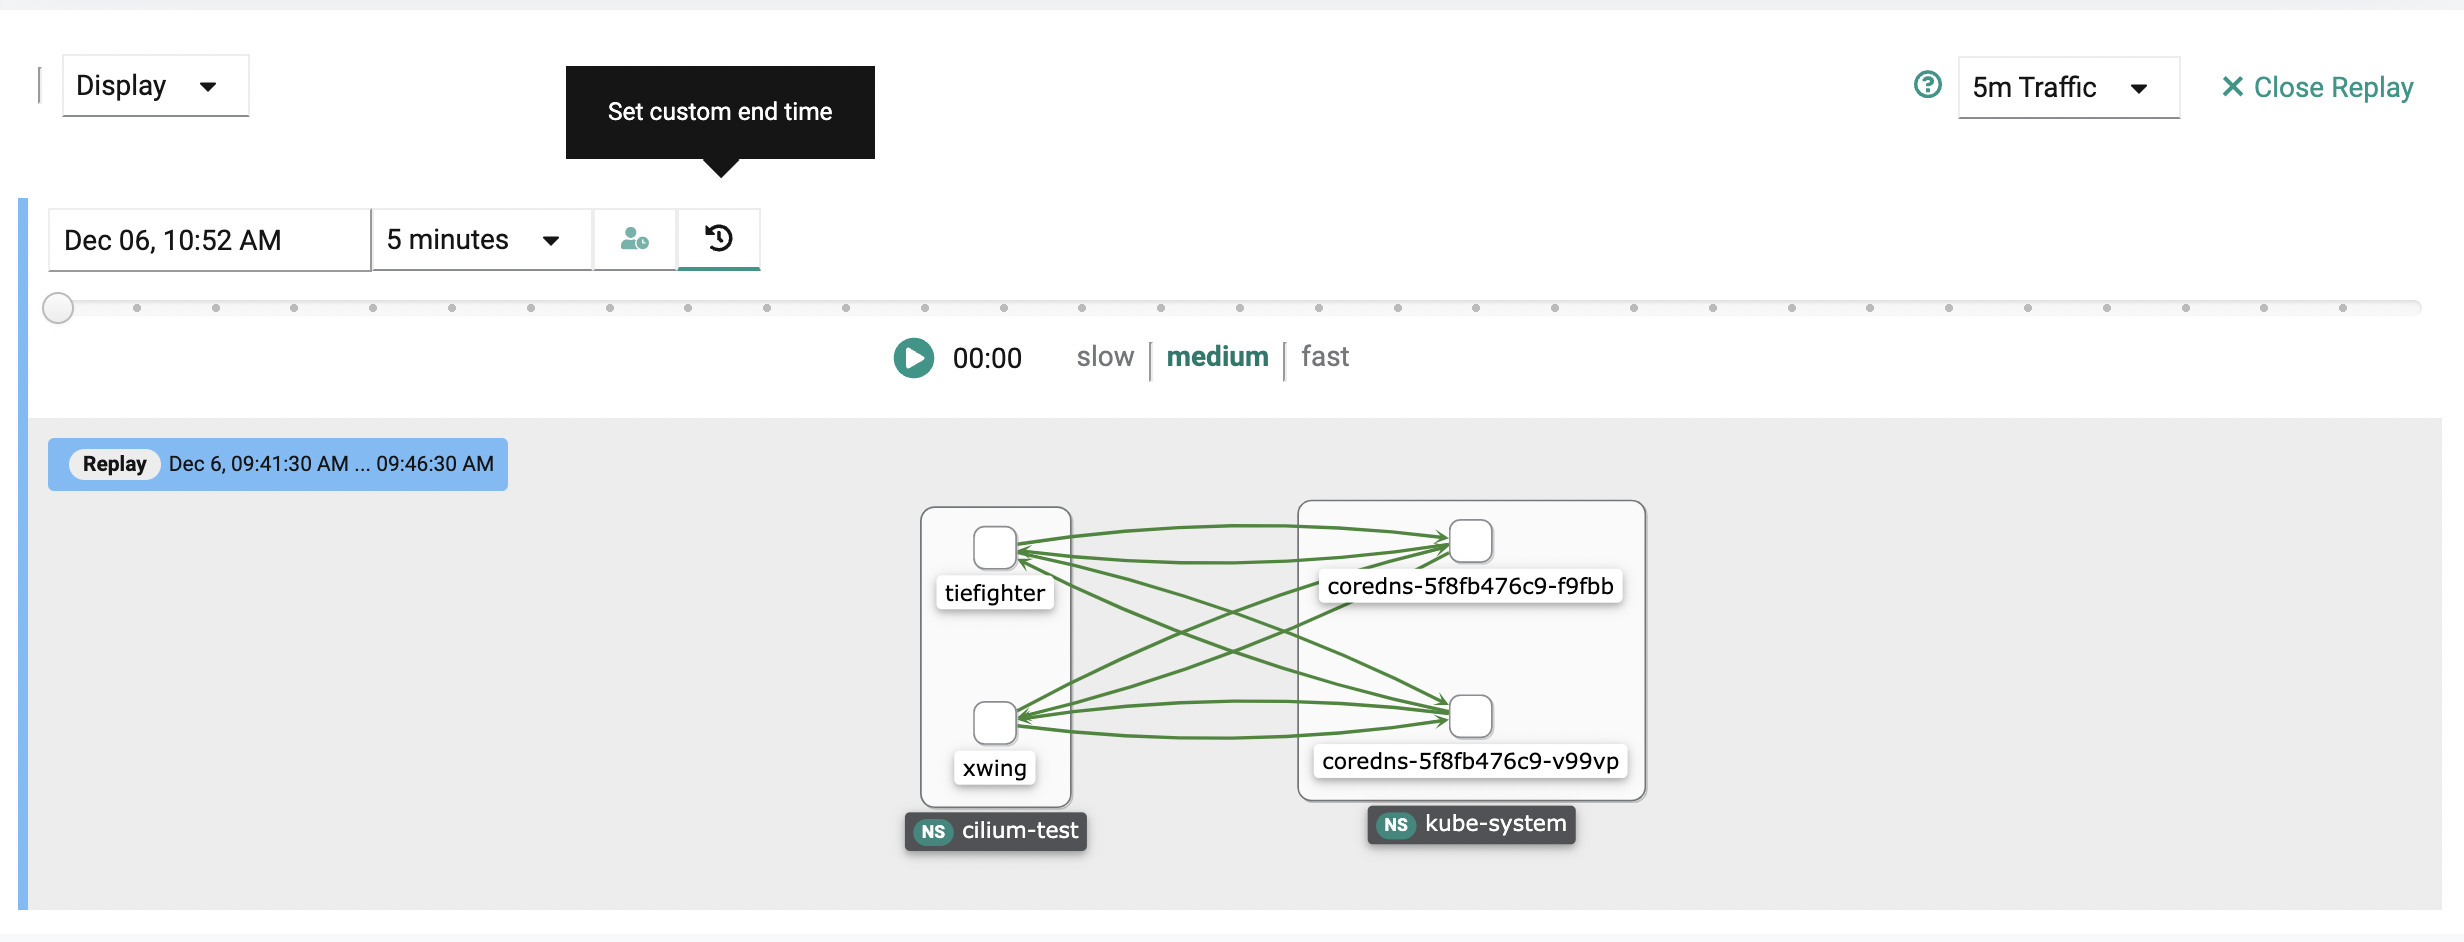
- select set custom end time
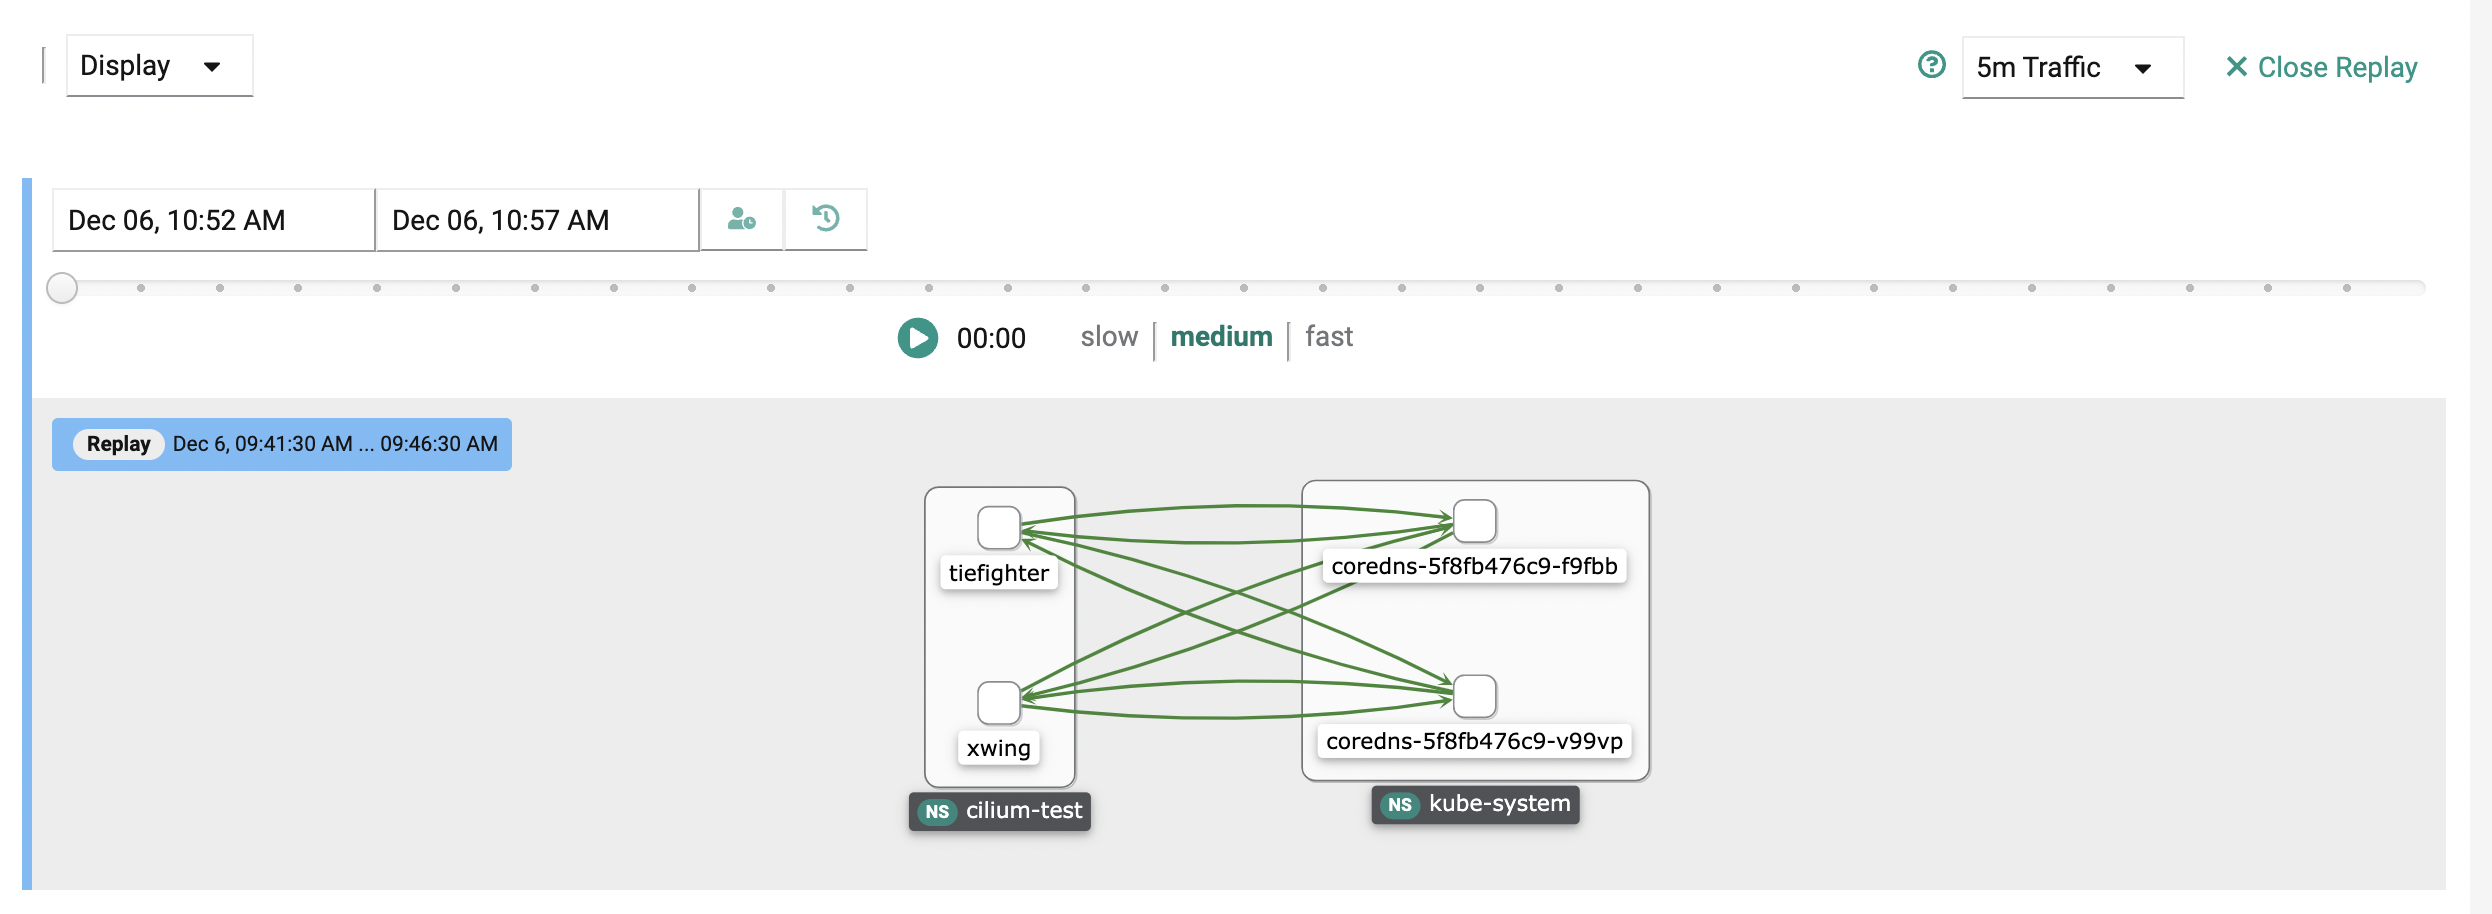
- use the calendar and time slots to select the date and time you want to replay from for both start and end time
- hit the play button to replay
- if you want to go back to the simple replay, click the set simple start time icon next to the fixed time interval dropdown.
Refreshing the screen
At the top right, you have the ability to refresh the visibility screens as well as determine the time on how often it should be refreshed. The default is every 15 seconds.
Resetting
If you want to use a new cluster, click the clear button at the top right to reset the project and cluster so that you can select a new one.