Explorer
Cost Explorer - Introduction
Cost Explorer is designed to assist with resource management and cost optimization by effectively tracking historical data. This facilitates the assessment of resource utilization efficiency, encompassing both 'Resource Requests' and actual 'Utilization.' Additionally, Cost Explorer provides essential drill-down capabilities, enabling in-depth analysis at the project, cluster, namespace, and chargeback group levels.
By leveraging these insights, organizations can make well-informed decisions, identify potential areas for improvement, and optimize resource allocation to achieve maximum efficiency and cost-effectiveness. Cost Explorer empowers businesses to proactively manage expenses and enhance overall cost optimization efforts.
Getting to the Dashboards - Cost Explorer
With Cost Explorer, you gain the ability to monitor spending patterns not only at a global level but also with a granular focus on specific aspects
-
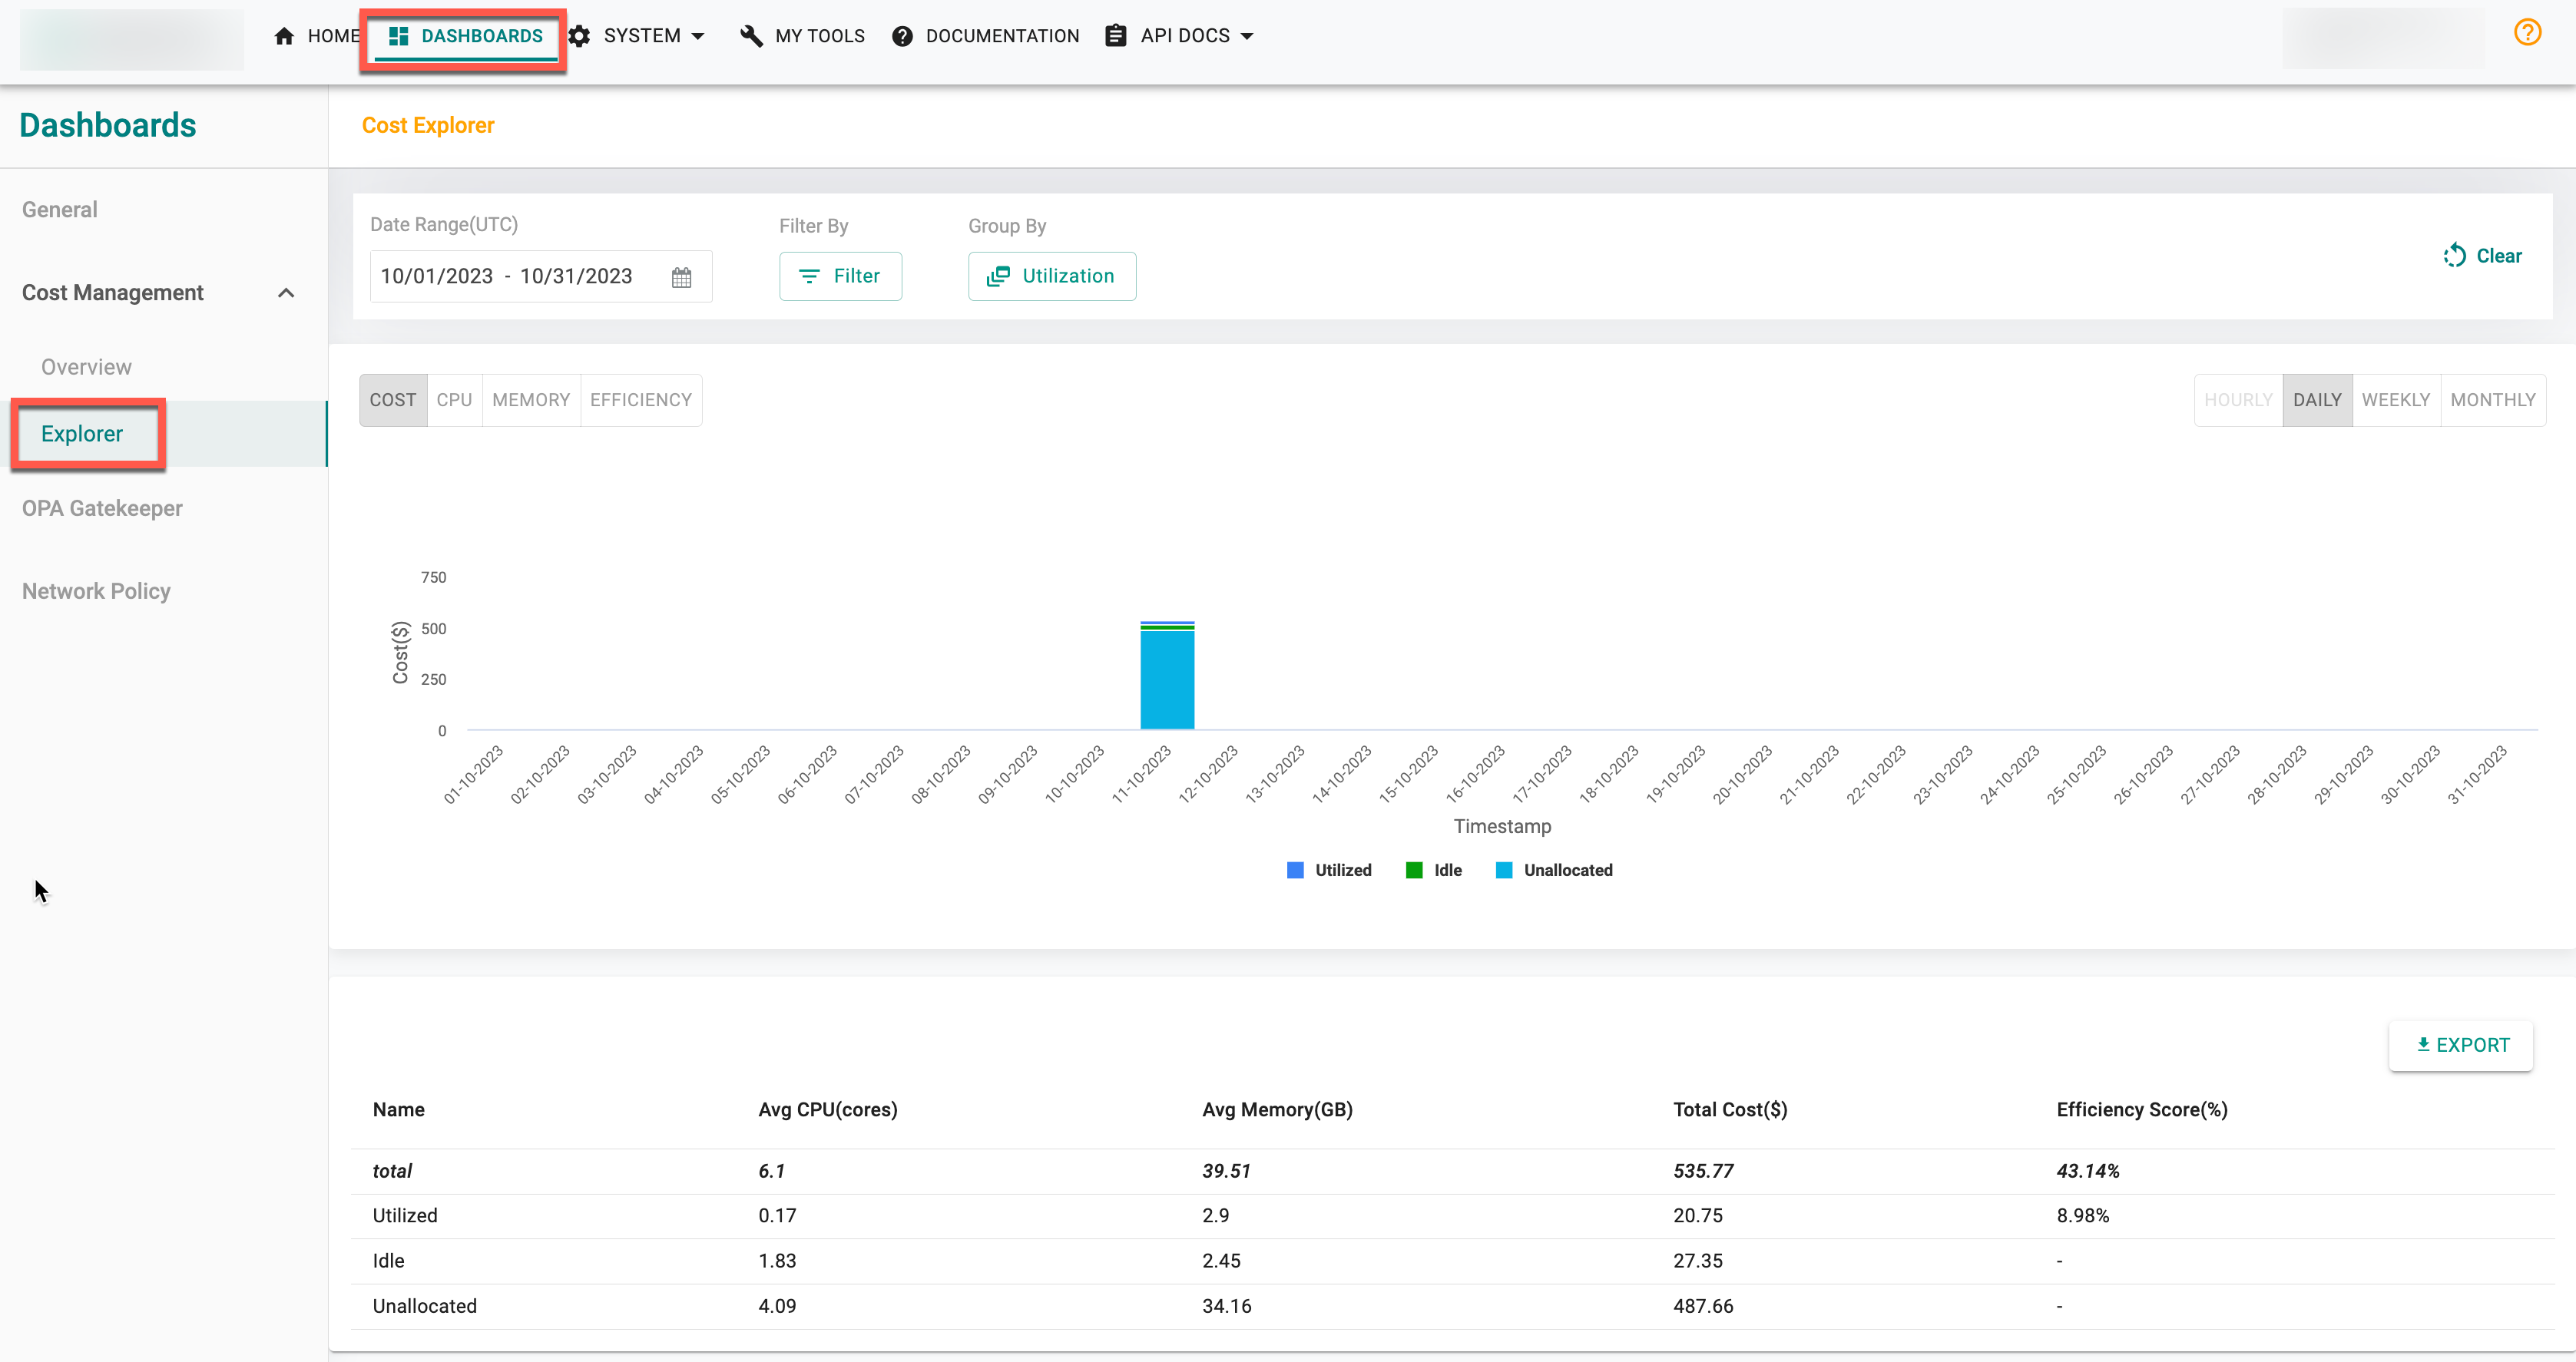
Login to the controller and click on dashboards
-
Select Cost Management and click Explorer. By default, Cost Explorer displays all project, cluster, and namespace cost metrics
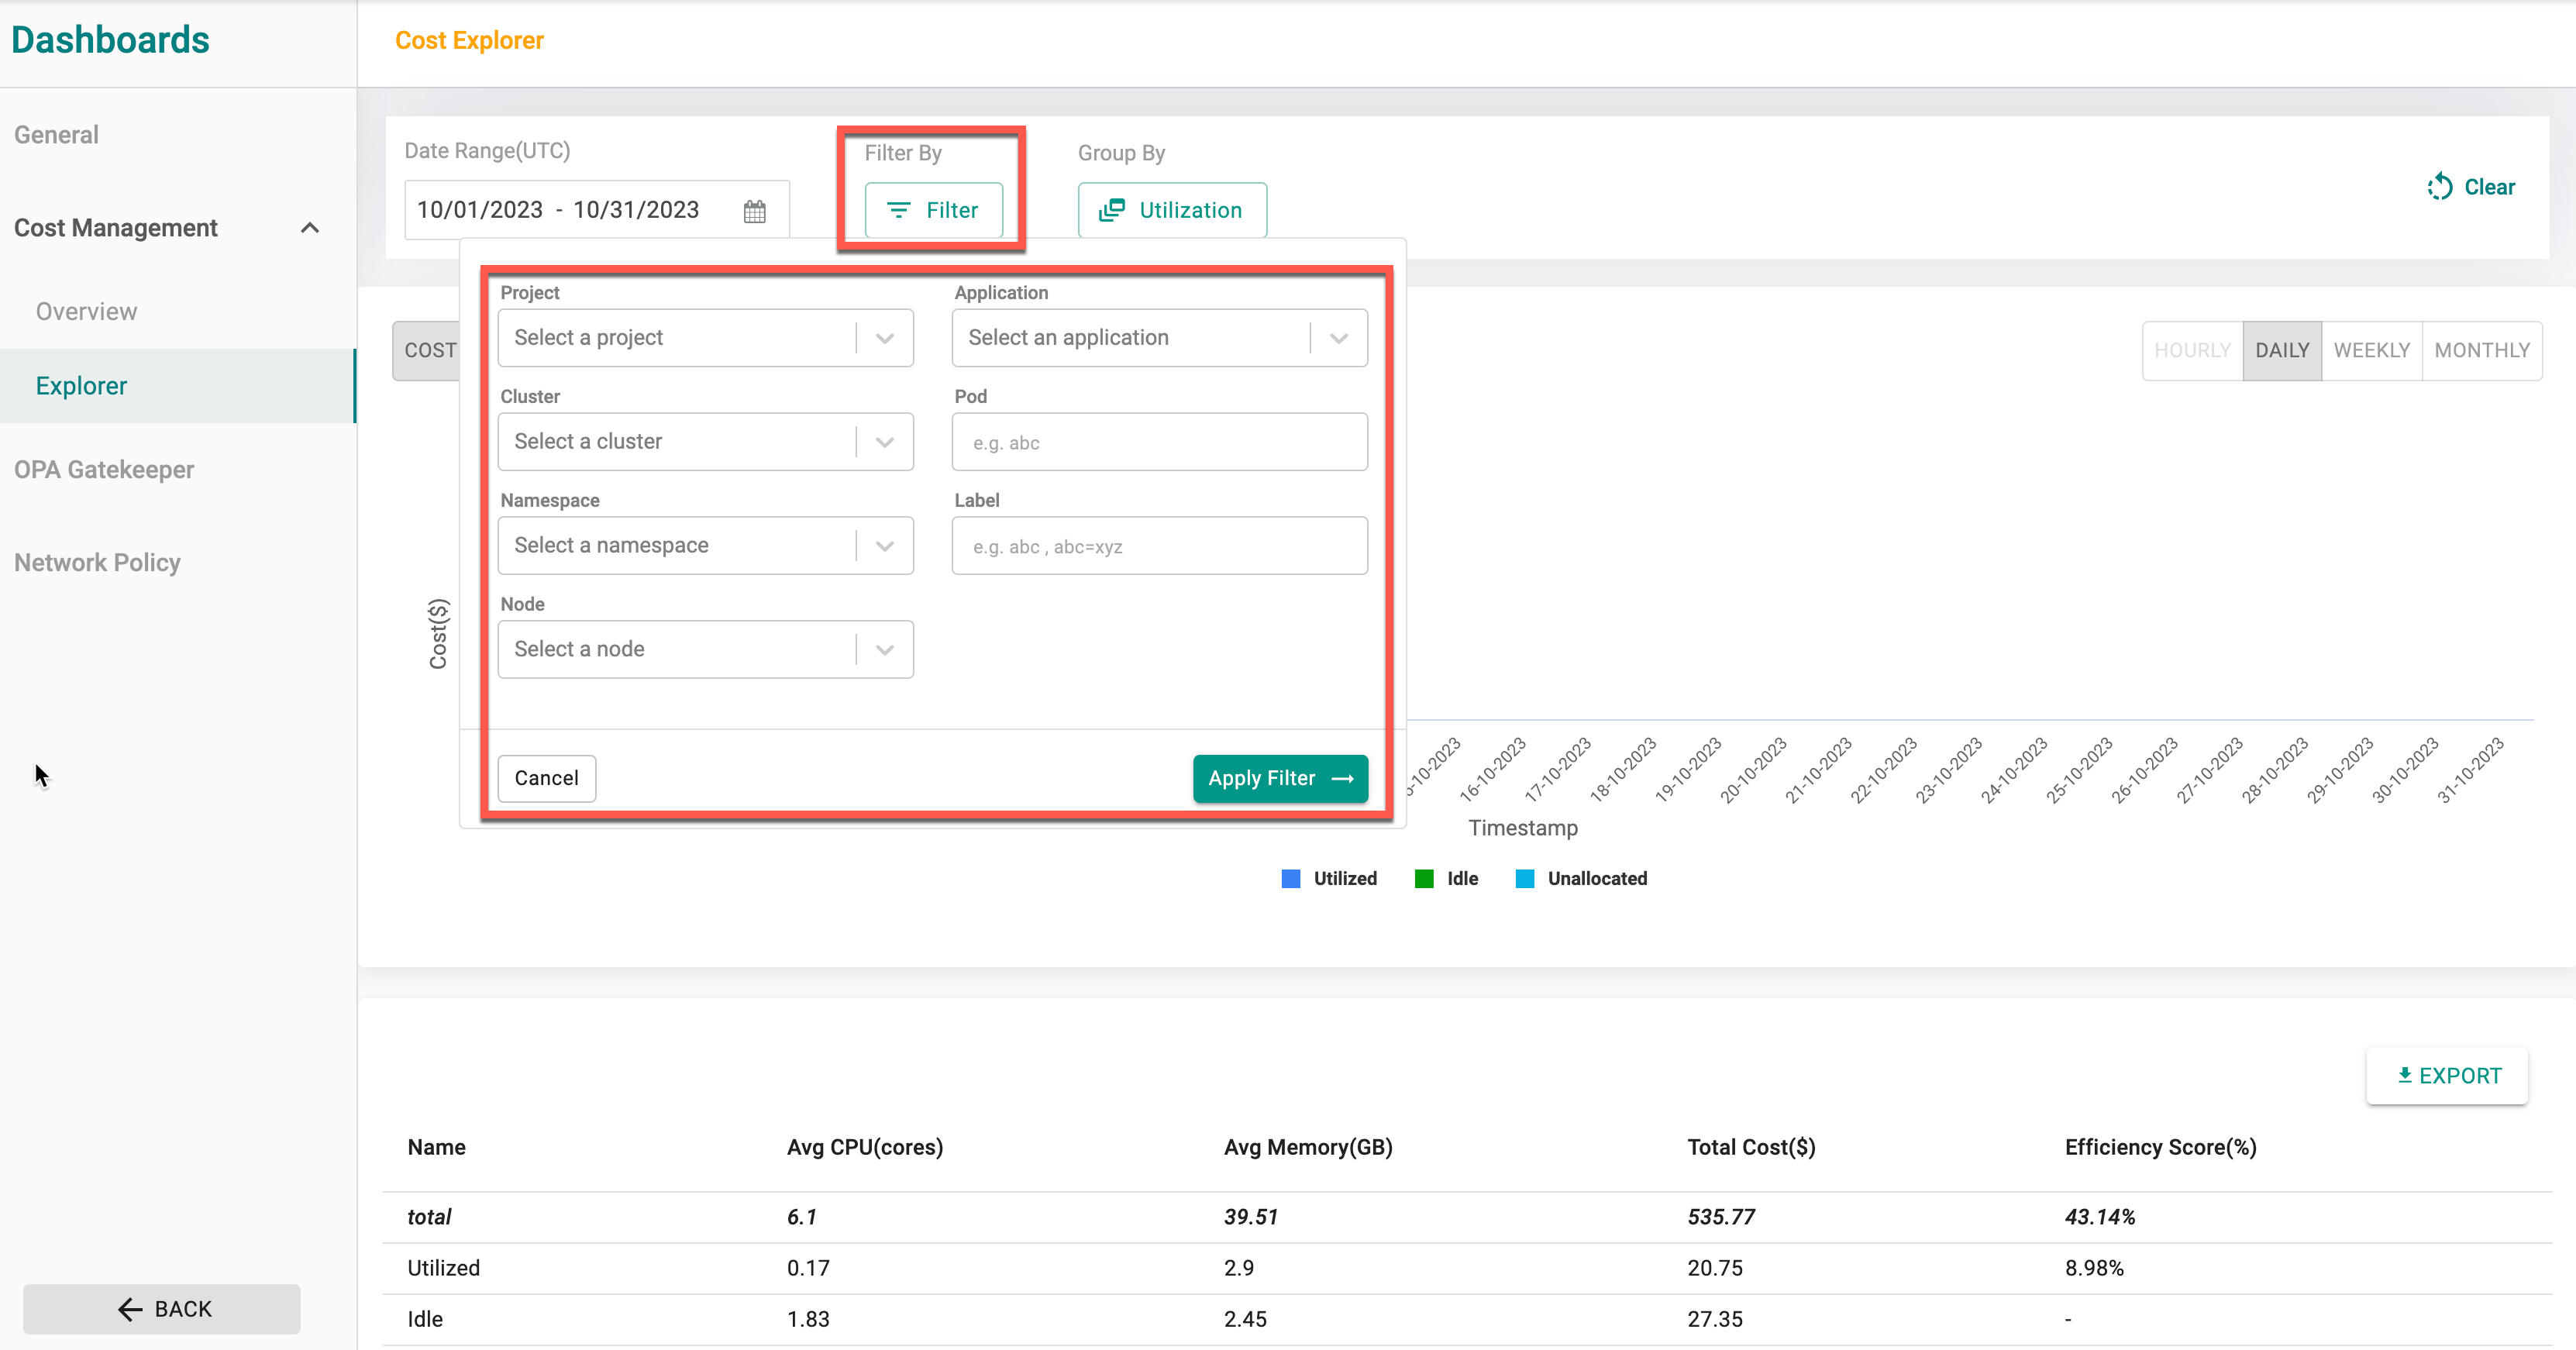
- To view the cost utilization report for a particular project, cluster, namespace, nodes, applications, pod, and labels, simply select the relevant options from the Filter By drop-down menu and click Apply Filter. Choose the required resource to determine the specific dataset. This combined data is then visualized through a bar graph and a tabular format. By selecting different dimensions, variations in the presentation of cost utilization can be observed.
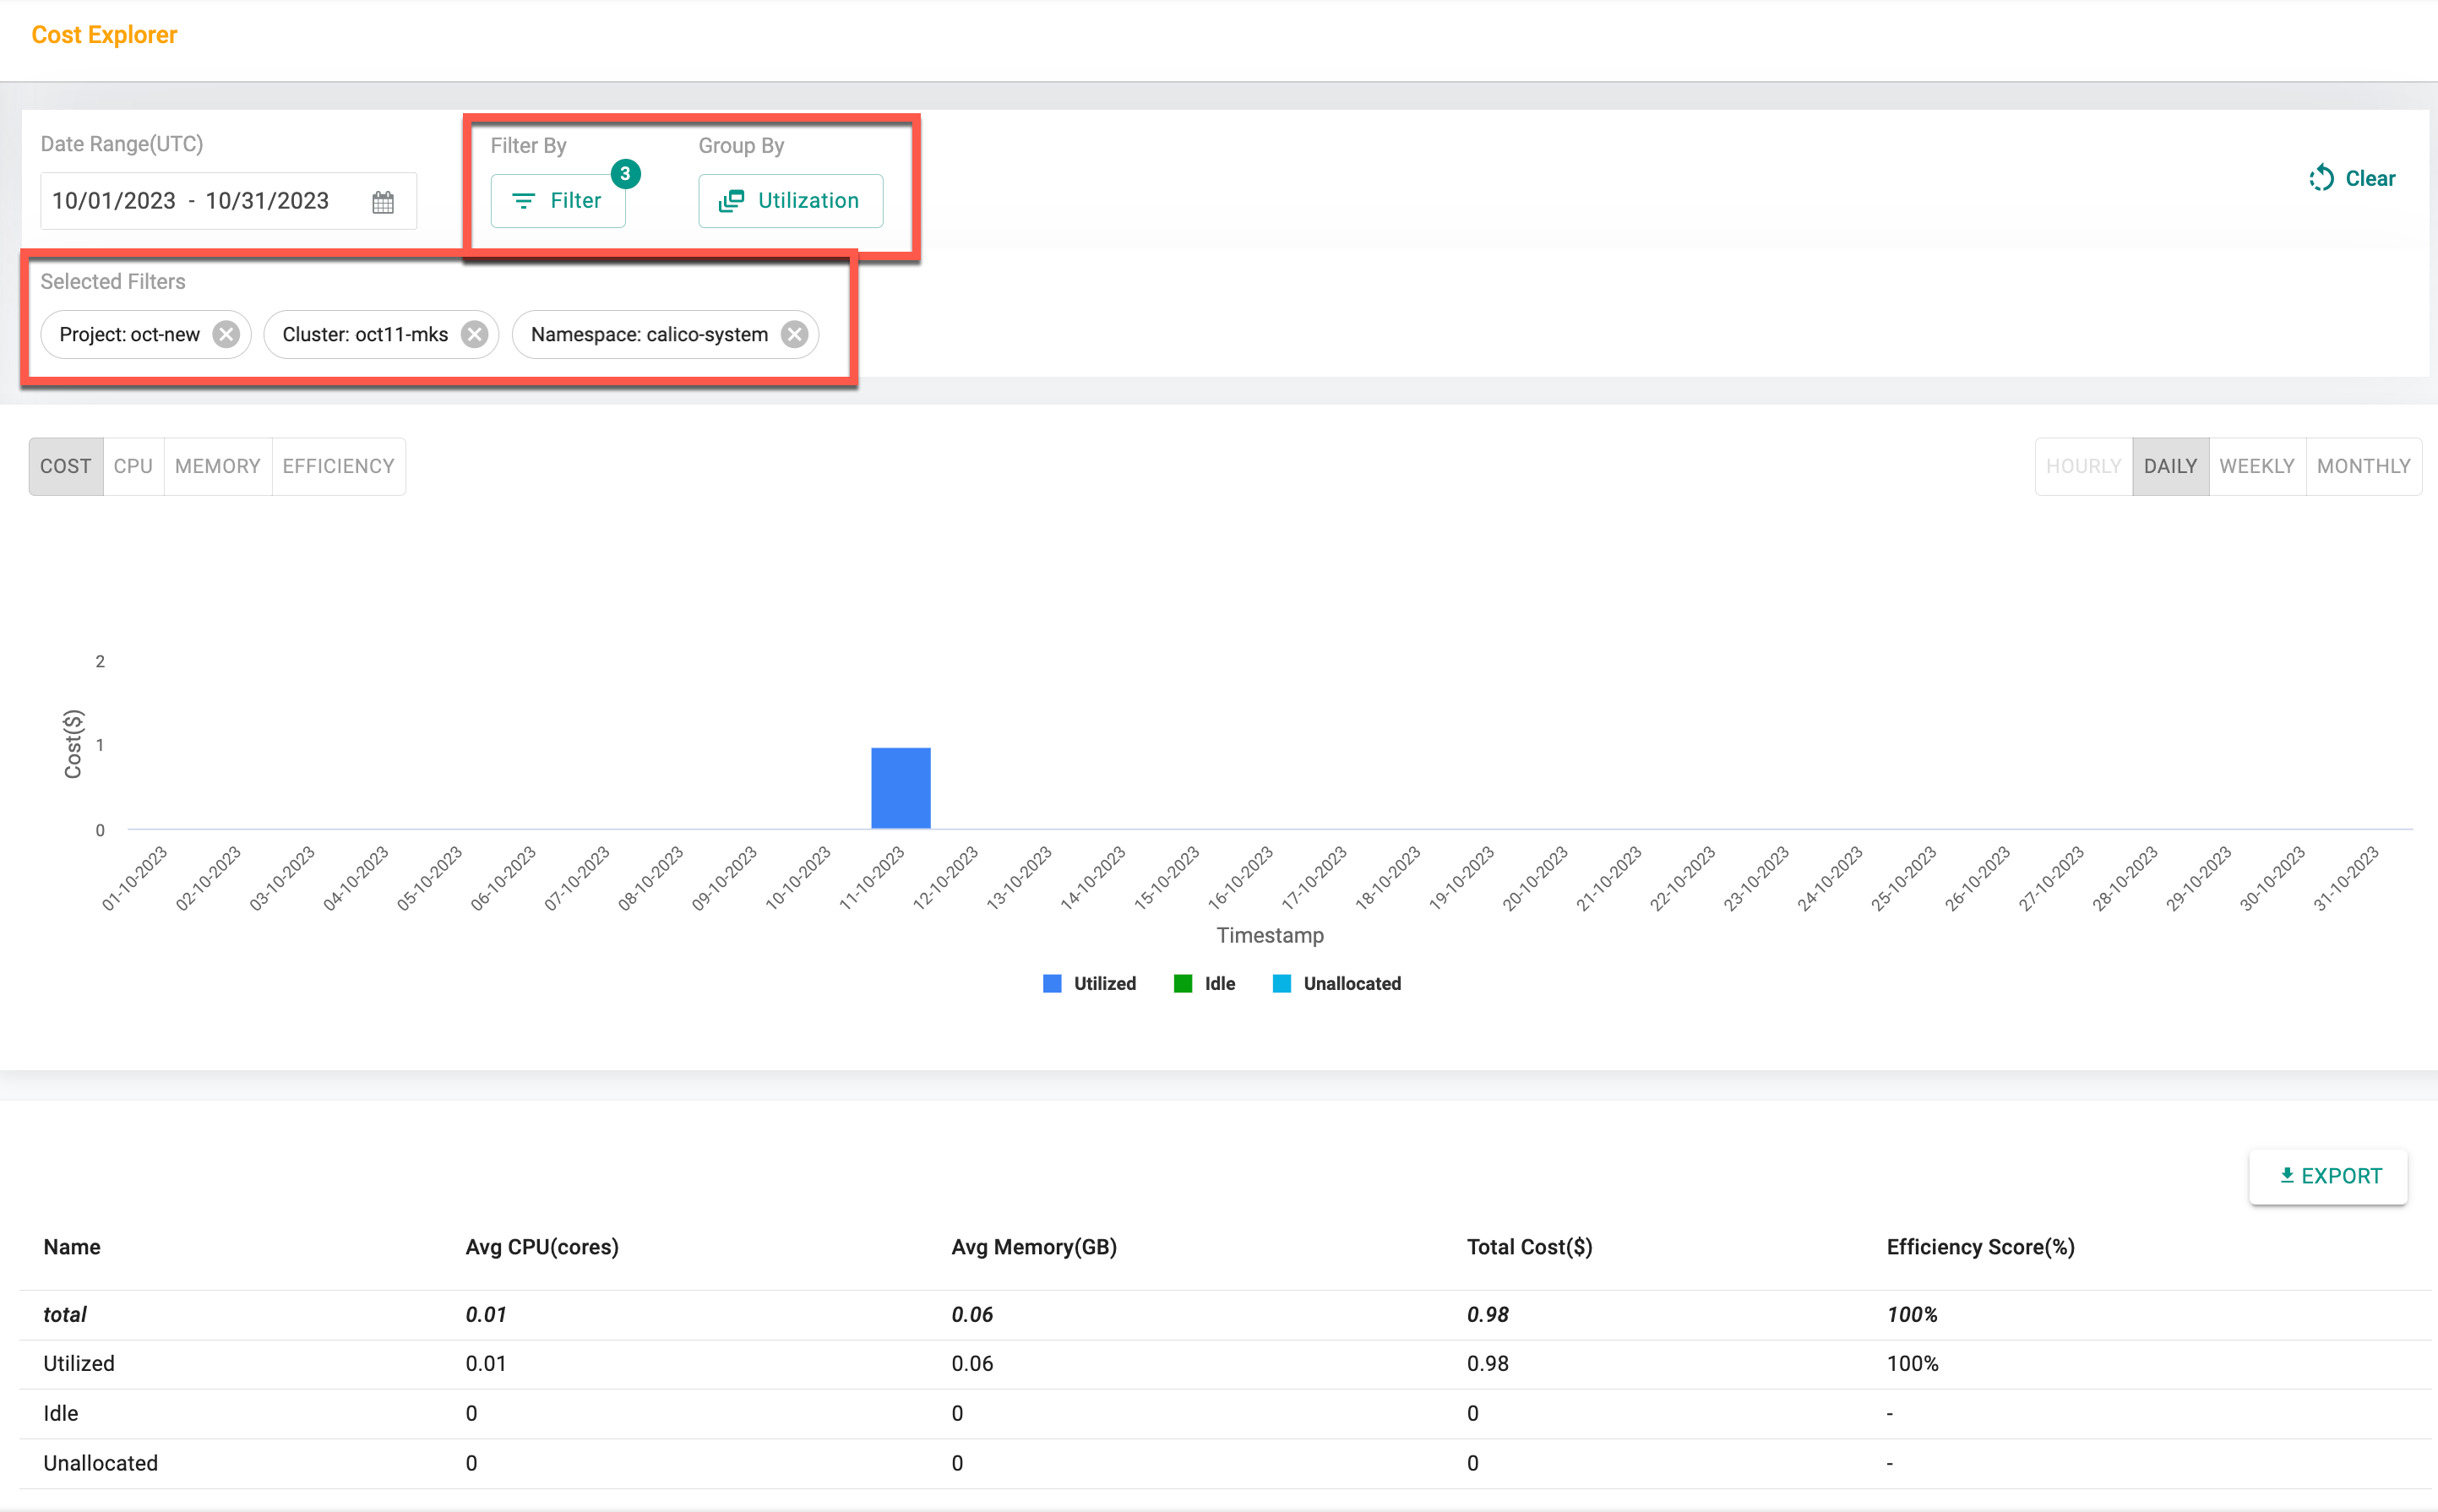
For instance, in the image below, you can observe the cost utilization of the namespace named calico-system in the cluster oct11-mks under the project oct-new with the Utilization Group By being considered. The report provides both graphical representation and a table view based on these selected criteria.
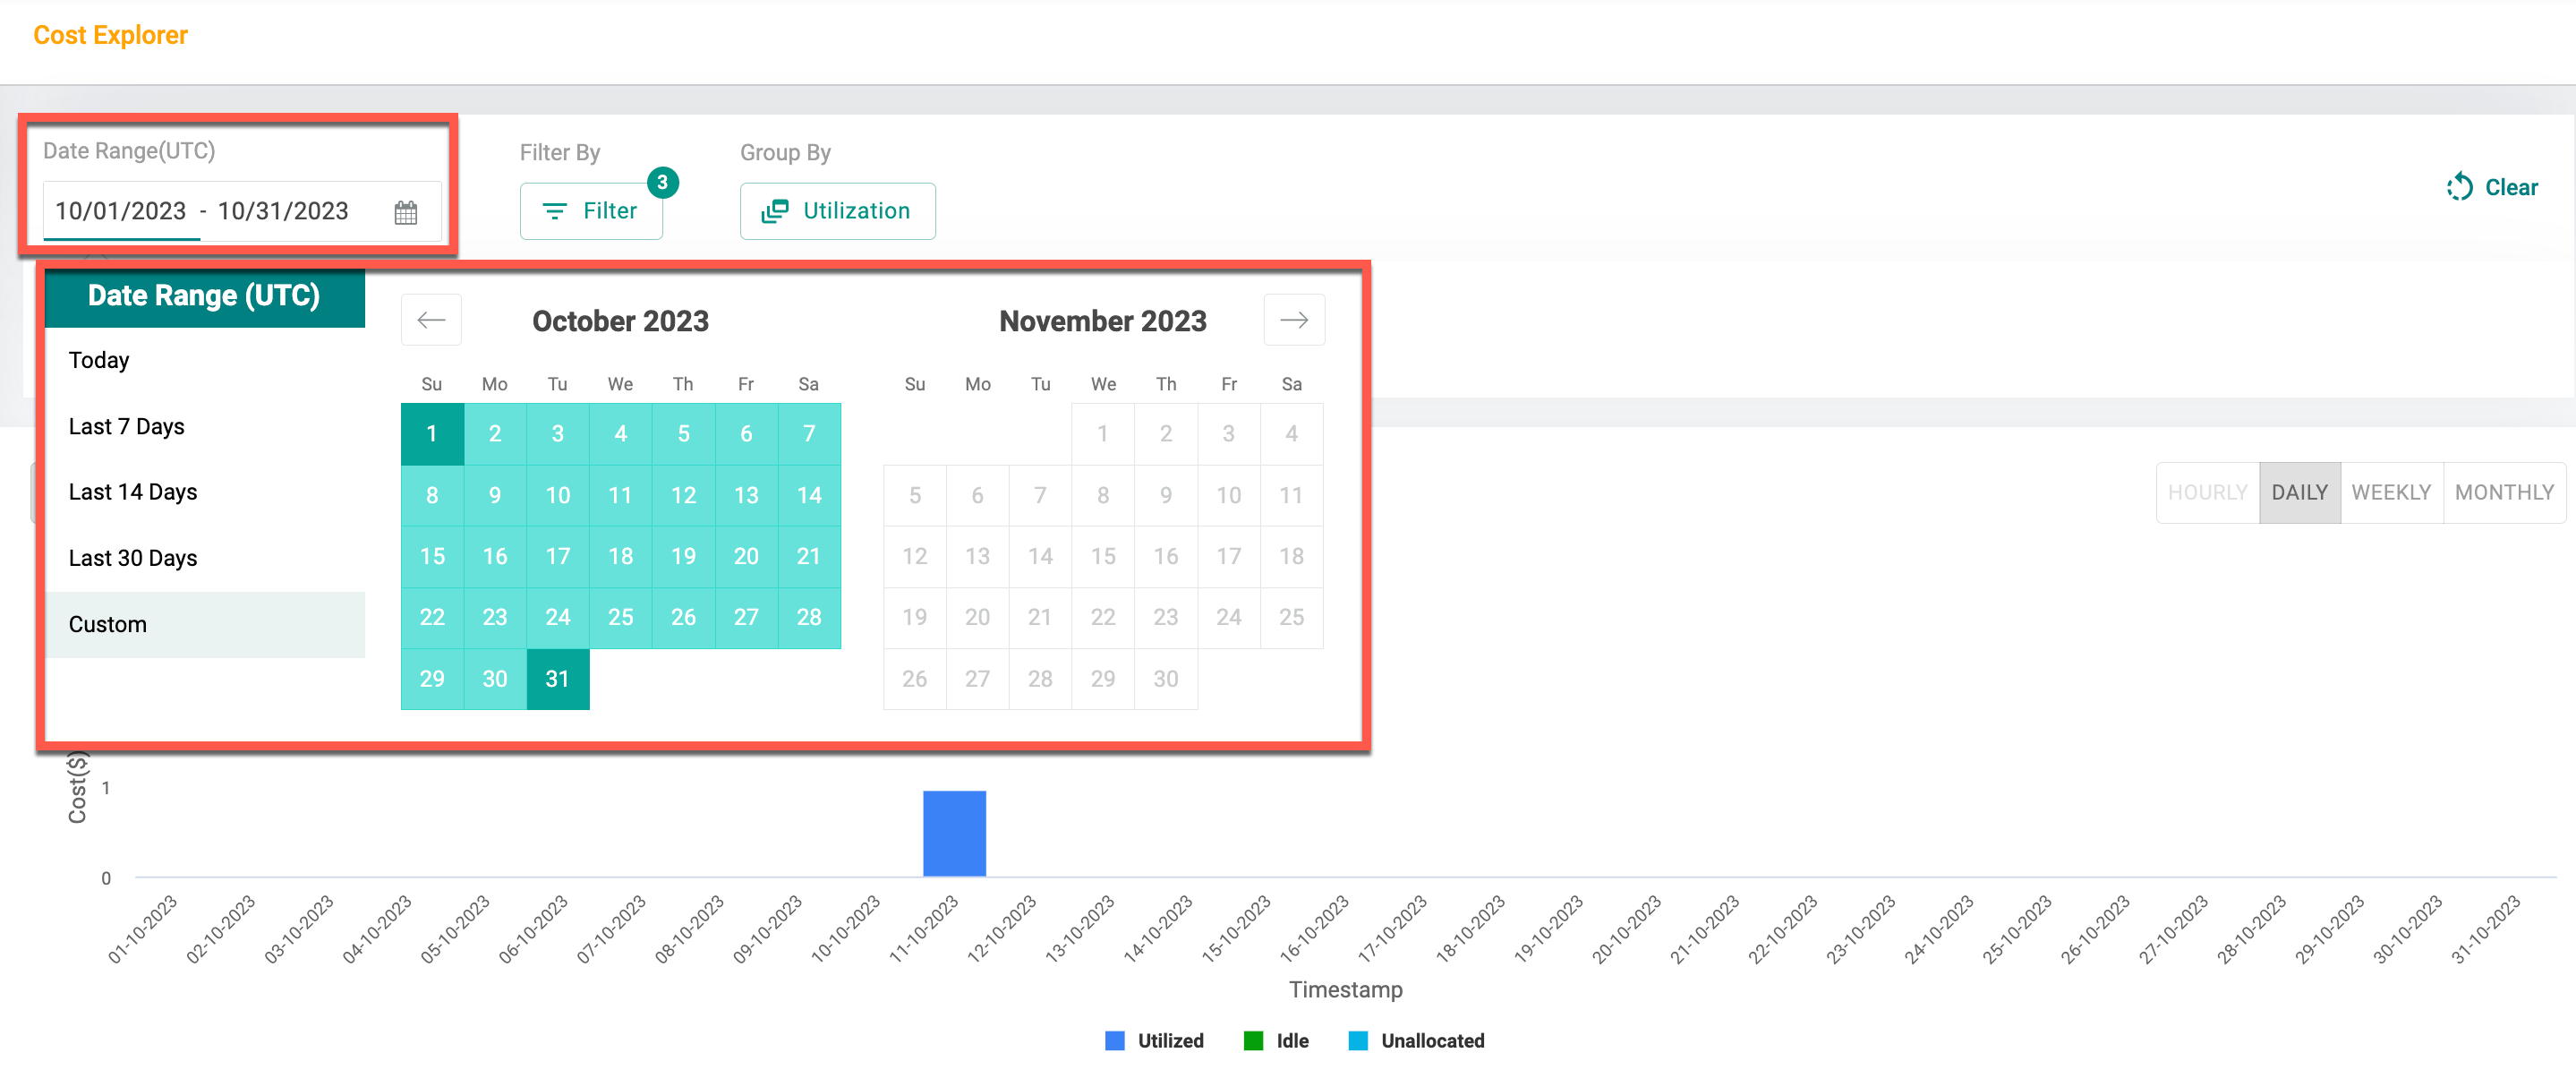
- Users have the option to choose a date range, allowing them to view reports for specific durations. Once the selection is made, both the graphical view and the table will display the cost utilization data accordingly
Opt for your desired dimension from the Group By drop-down menu, and the graphical view and table will dynamically adjust to present the corresponding cost utilization data. These dimensions are displayed based on the selection of the filter.
Visual Depiction
When opting for the default Utilization Dimension from Group By, the graphs depict the utilization of resources such as Cost, CPU, Memory, and Efficiency. These visualizations take into account the combination of resource(s) selection from the Filter By drop-down, providing a comprehensive overview of utilization. To delve deeper into the data, simply hover over the graphical bars. This action reveals detailed information about utilized, idle, and total costs, empowering you with a clearer understanding of your resource allocation and expenditure. The other dimensions will just show the cost utilization.
When opting for the alternative dimension, the graphs only display the usage metric for the Cost of resources.
As an example, the screen below showcases the cost utilization of all namespaces. This selection combines both the chosen dimensions and the filters from the first level, encompassing project, cluster, namespace, nodes, pods, applications and labels.
Select the desired duration from a range of options, including hourly, daily, weekly, and monthly. Once a selection is made, the report retrieves and displays the data corresponding to the chosen duration.
Hover over the graphical bars to view the information of the available namespaces within this cluster. The data displayed includes the total cost and utilization cost of each namespace for the selected duration.

Tablular Data
The cost utilization report is presented in a tabular format, and its content varies depending on the chosen dimension and first level filters. Apart from the utilization dimension, users can sort the required columns for other dimensions. This will sort the values, but the total cost will remain constant in the first row as it represents the total values according to the selected dimension.
- The table view of the utilization dimension provides a comprehensive dataset tailored to the selected filters. This dataset includes relevant details such as Average CPU (cores), Average Memory (GB), Total Cost ($), and Efficiency Score (%) as shown below

- The table view of the Projects provides a comprehensive dataset tailored to the selected filters. This dataset includes relevant details such as Avg. CPU Requested(cores), Avg. CPU Usage(cores), Avg. CPU Unallocated(cores), Avg. CPU Efficiency(%), Avg. Memory Requested(GB), Avg. Memory Usage(GB), Avg. Memory Unallocated(GB), Avg. Memory Efficiency(%), Resource Efficiency(%) (with a tooltip), Util Efficiency(%) (with a tooltip), Allocated Cost(), Utilized Cost(), Idle Cost(), and Total Cost() as shown below

- The table view of the Clusters, and Nodes dimension provides a comprehensive dataset tailored to the selected filters. This dataset includes relevant details such as Avg CPU Requested(cores), Avg CPU Usage(cores), Avg CPU Unallocated(cores), Avg Memory Requested(GB), Avg Memory Usage(GB), Avg Memory Unallocated(GB), Resource Efficiency(%), Util Efficiency(%) and Total Cost($) as shown below.

- The table view of the Namespaces, Applications, Providers, and Labels dimension provides a comprehensive dataset tailored to the selected filters. This dataset includes relevant details such as Name Avg CPU Requested(cores), Avg CPU Usage(cores), Avg Memory Requested(GB), Avg Memory Usage(GB), Resource Efficiency(%), and Total Cost($) as shown below

Important
The tabular columns vary based on the combination of filter and group selections
- To export the report, including your selected filters and options, simply click on the Export button. This action will generate the report in CSV format, allowing you to further analyze and work with the data as needed. Use the gear icons to show/hide the selected columns in both the UI table and the exported file.
