Part 1: Provision
This is Part 1 of a multi-part, self-paced quick start exercise that will focus on provisioning an EKS cluster in AWS using the web console, RCTL CLI, or Terraform.
What Will You Do
In part 1, you will:
- Create a Cloud Credential
- Configure and Provision an Amazon EKS cluster
- Access the cluster using the integrated "Kubernetes Resources Dashboard"
Watch a video of this exercise.
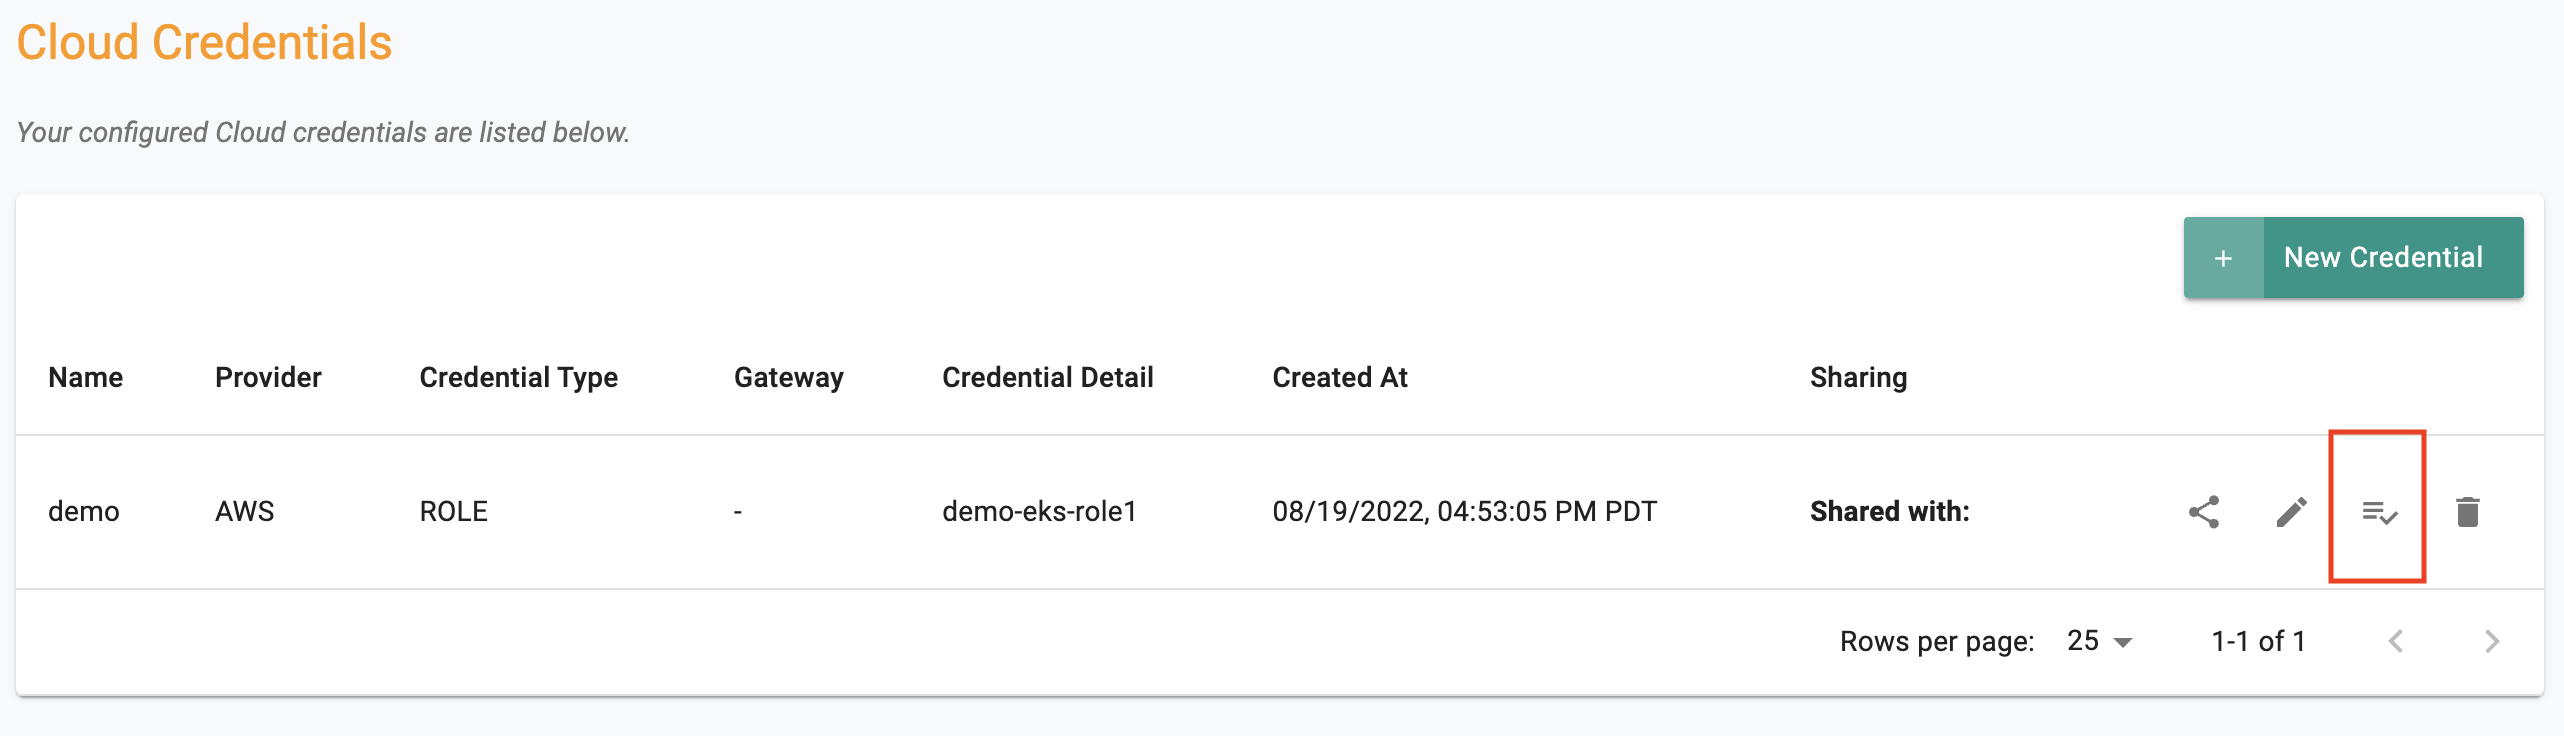
Step 1: Create Cloud Credential
Cloud credentials provide the controller with the privileges required to programmatically interact with your Amazon AWS account to manage the lifecycle of infrastructure associated with the Amazon EKS cluster.
- Follow the step-by-step instructions to create an IAM Role based cloud credential.
- In our example, our cloud credential is named "demo"
- Click on "Validate" to verify if the newly created cloud credential to ensure it is configured properly.
Step 2: Configure EKS Cluster
In this step, you will configure and provision an Amazon EKS Cluster with the following configuration:
- A private (cloaked) EKS control plane in the "us-west-2" region
- Auto create new VPCs and subnets
- A "managed node group" with two worker nodes based on "t3.large" instance type
The following will be automatically selected by default
- gp3 storage volumes
- Amazon Linux2 OS for the worker nodes
- IAM roles for ASG and ECR access enabled
- Minimal Cluster Blueprint
Select a method to provision and manage your EKS cluster from the tabs below.
Login into the controller's web console and into your Org.
- Navigate to the "defaultproject" and click on "New Cluster"
- Select "Public Cloud -> AWS -> EKS"
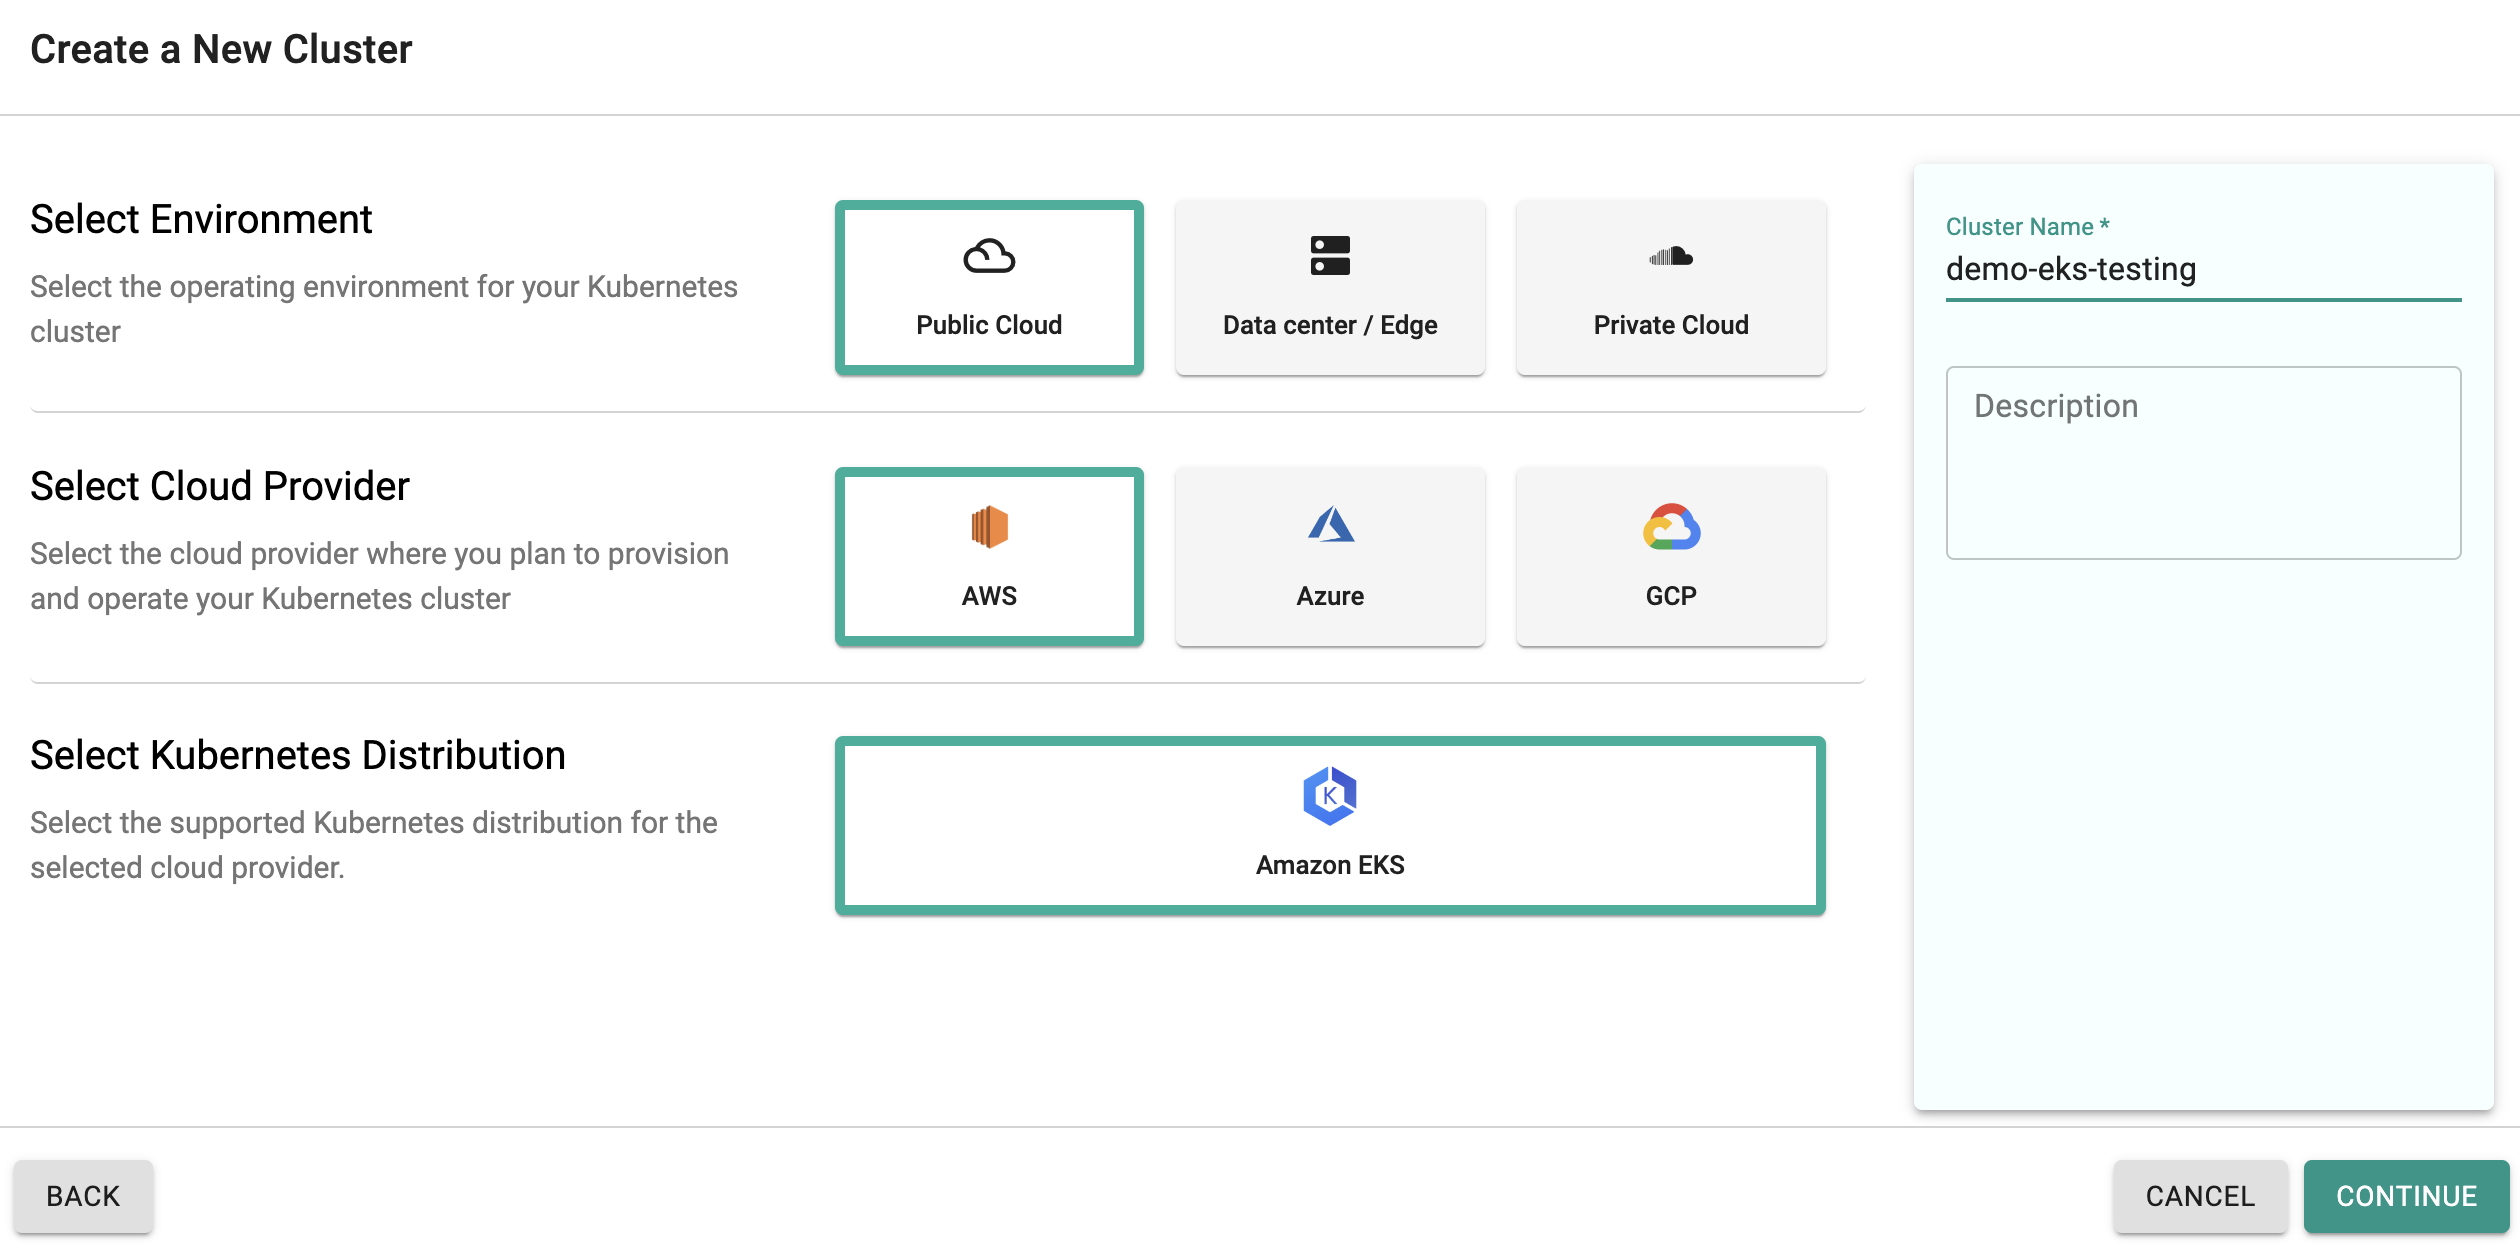
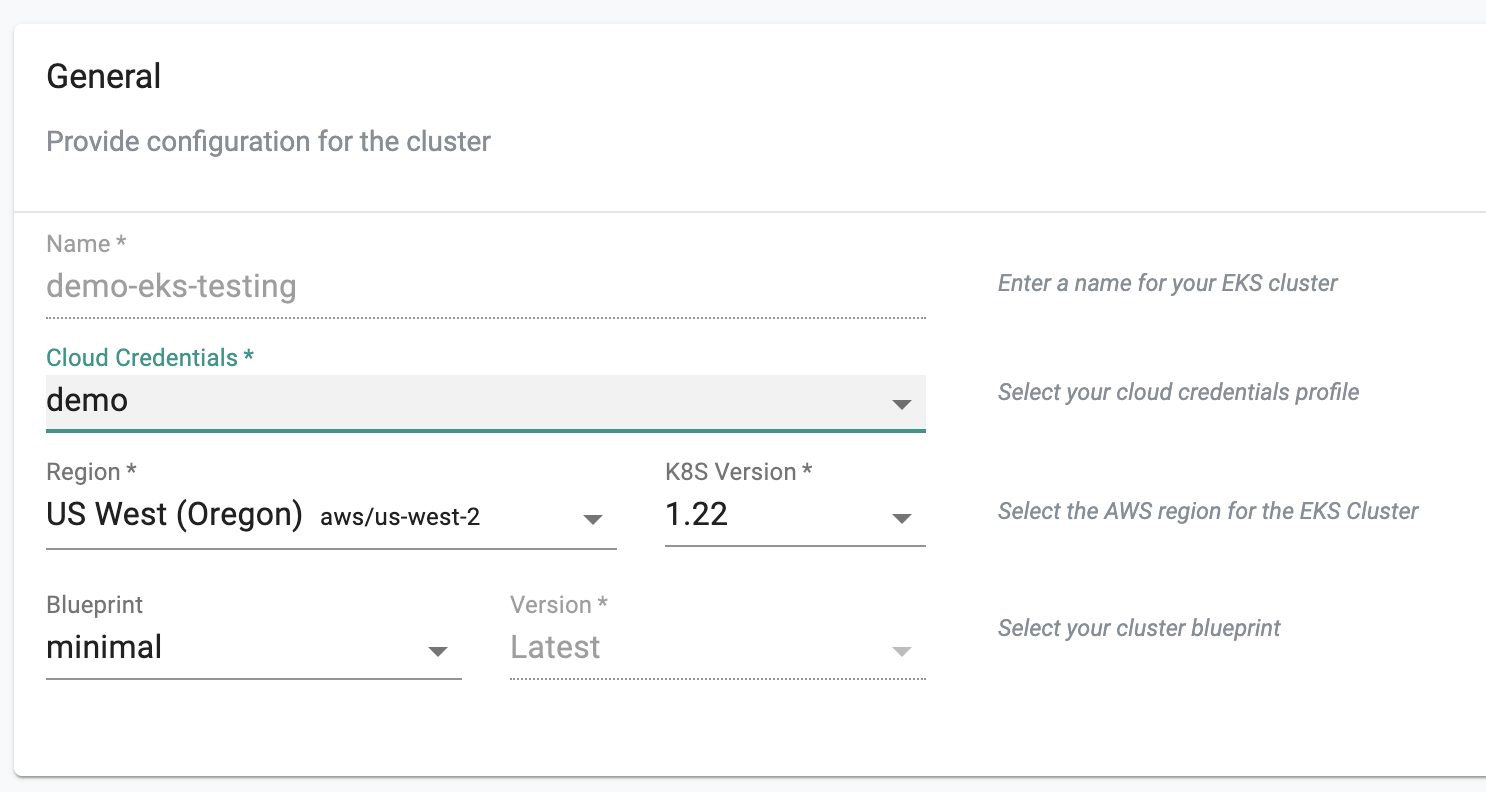
In the cluster configuration wizard,
- Enter the "name" for the EKS cluster (demo-eks-testing in our case)
- Select the "cloud credential" from the drop down
- Select "us-west-2" from the region drop down
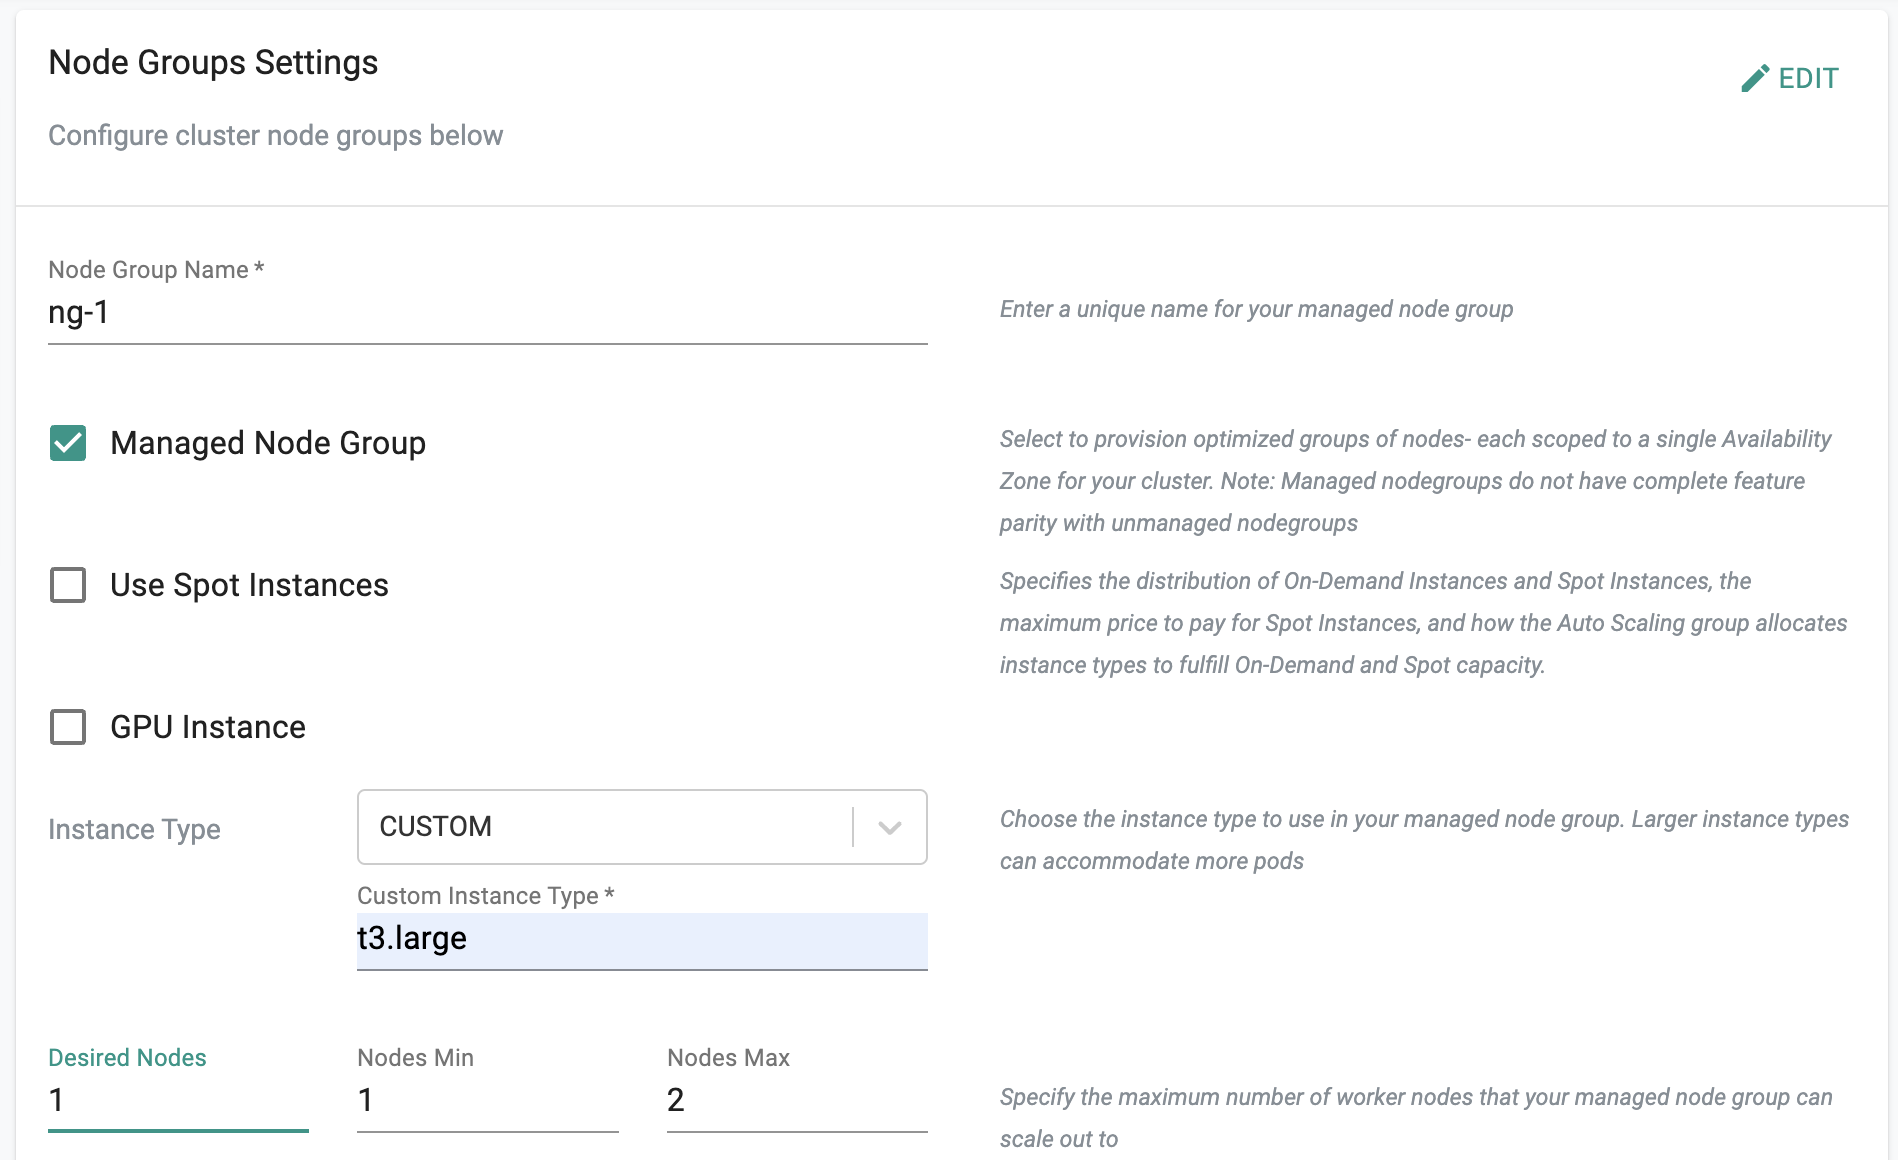
In the node group settings,
- For the node group name, enter "ng-1"
- Ensure "Managed Node Group" is selected
- Enter "t3.large" for the instance type after selecting "custom"
Click on "Save Changes" and Click on "Provision" to start provisioning the EKS Cluster in your AWS account.
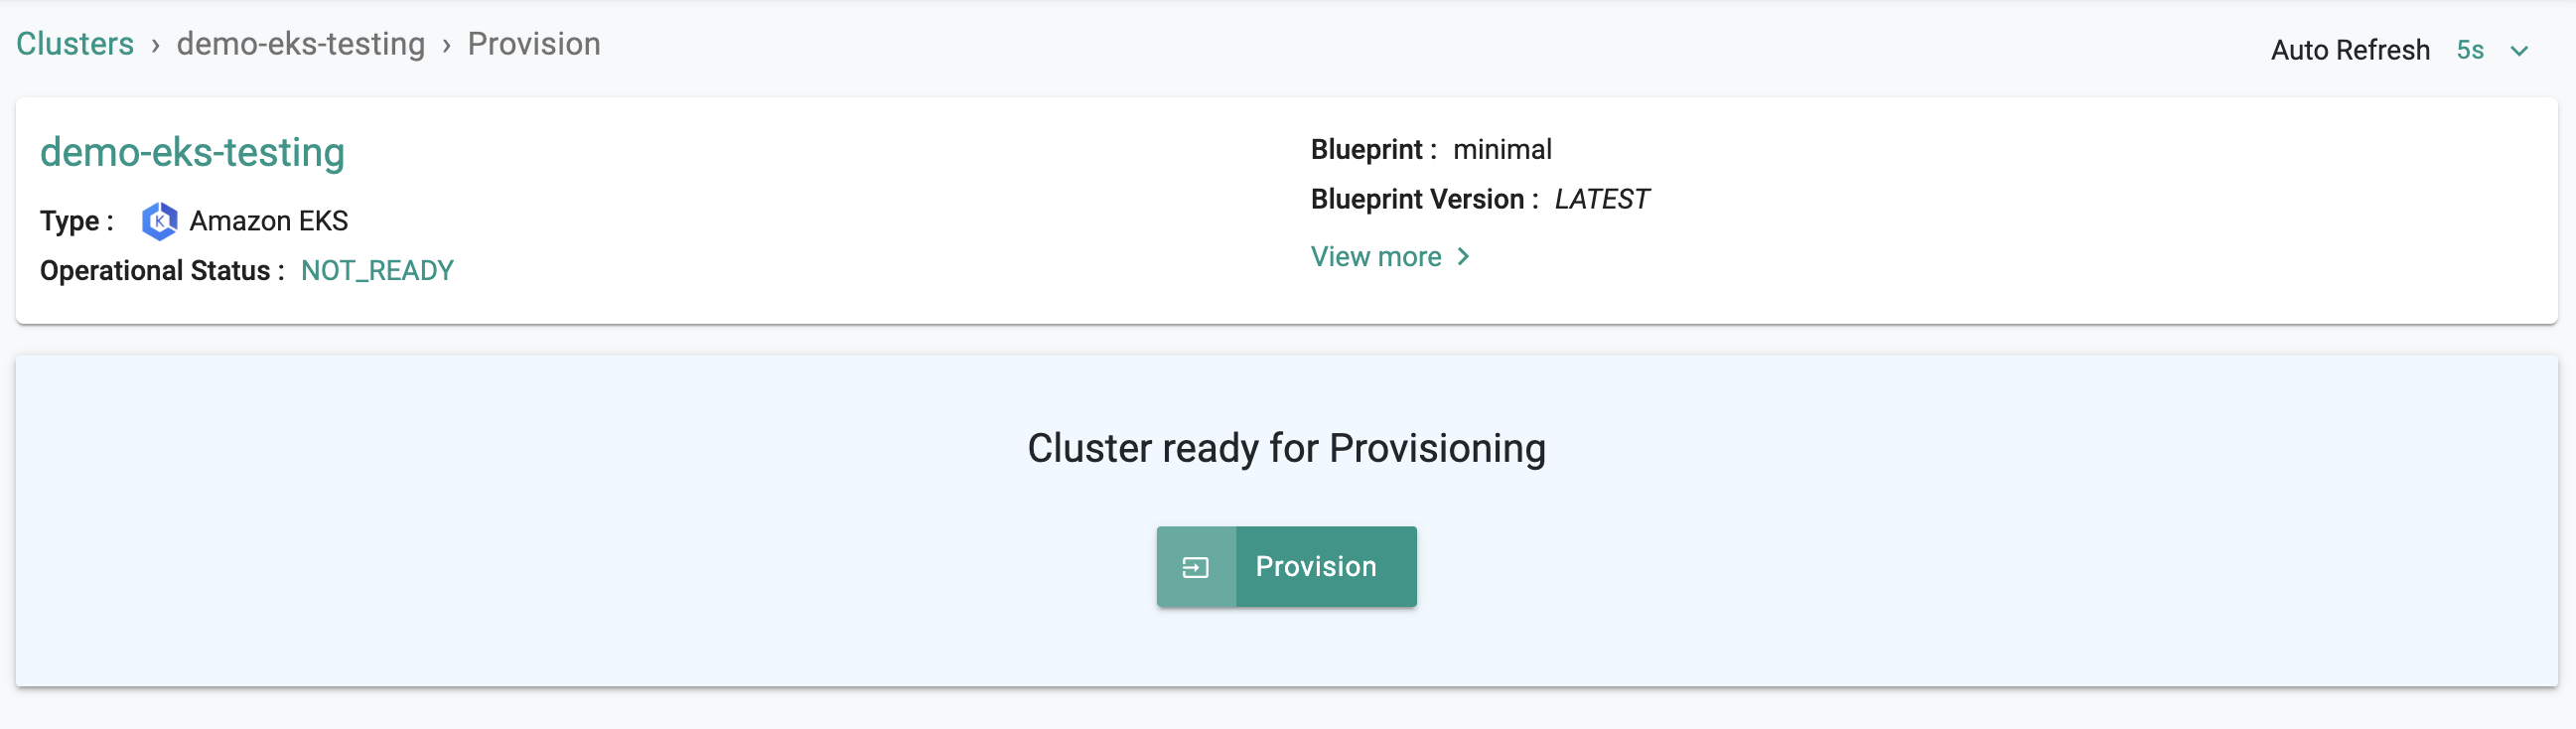
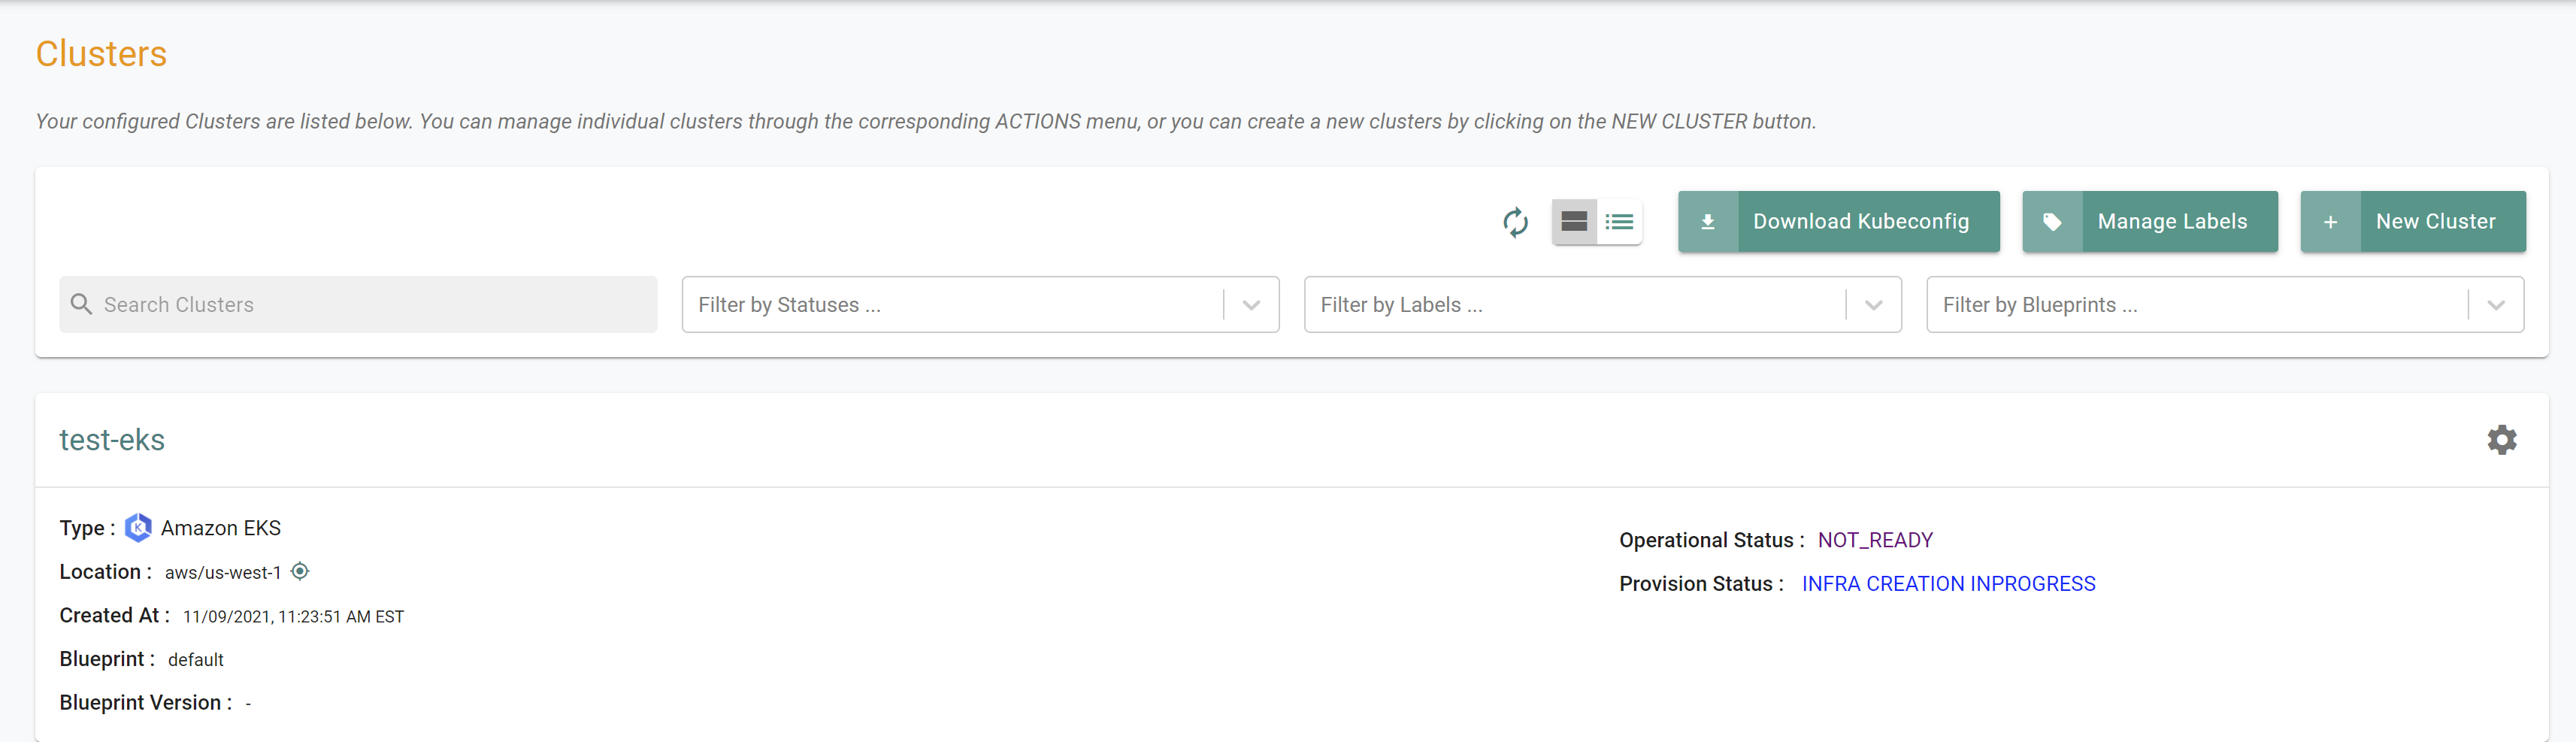
You can monitor the progress of your Amazon EKS cluster being provisioned step by step right in the web console.
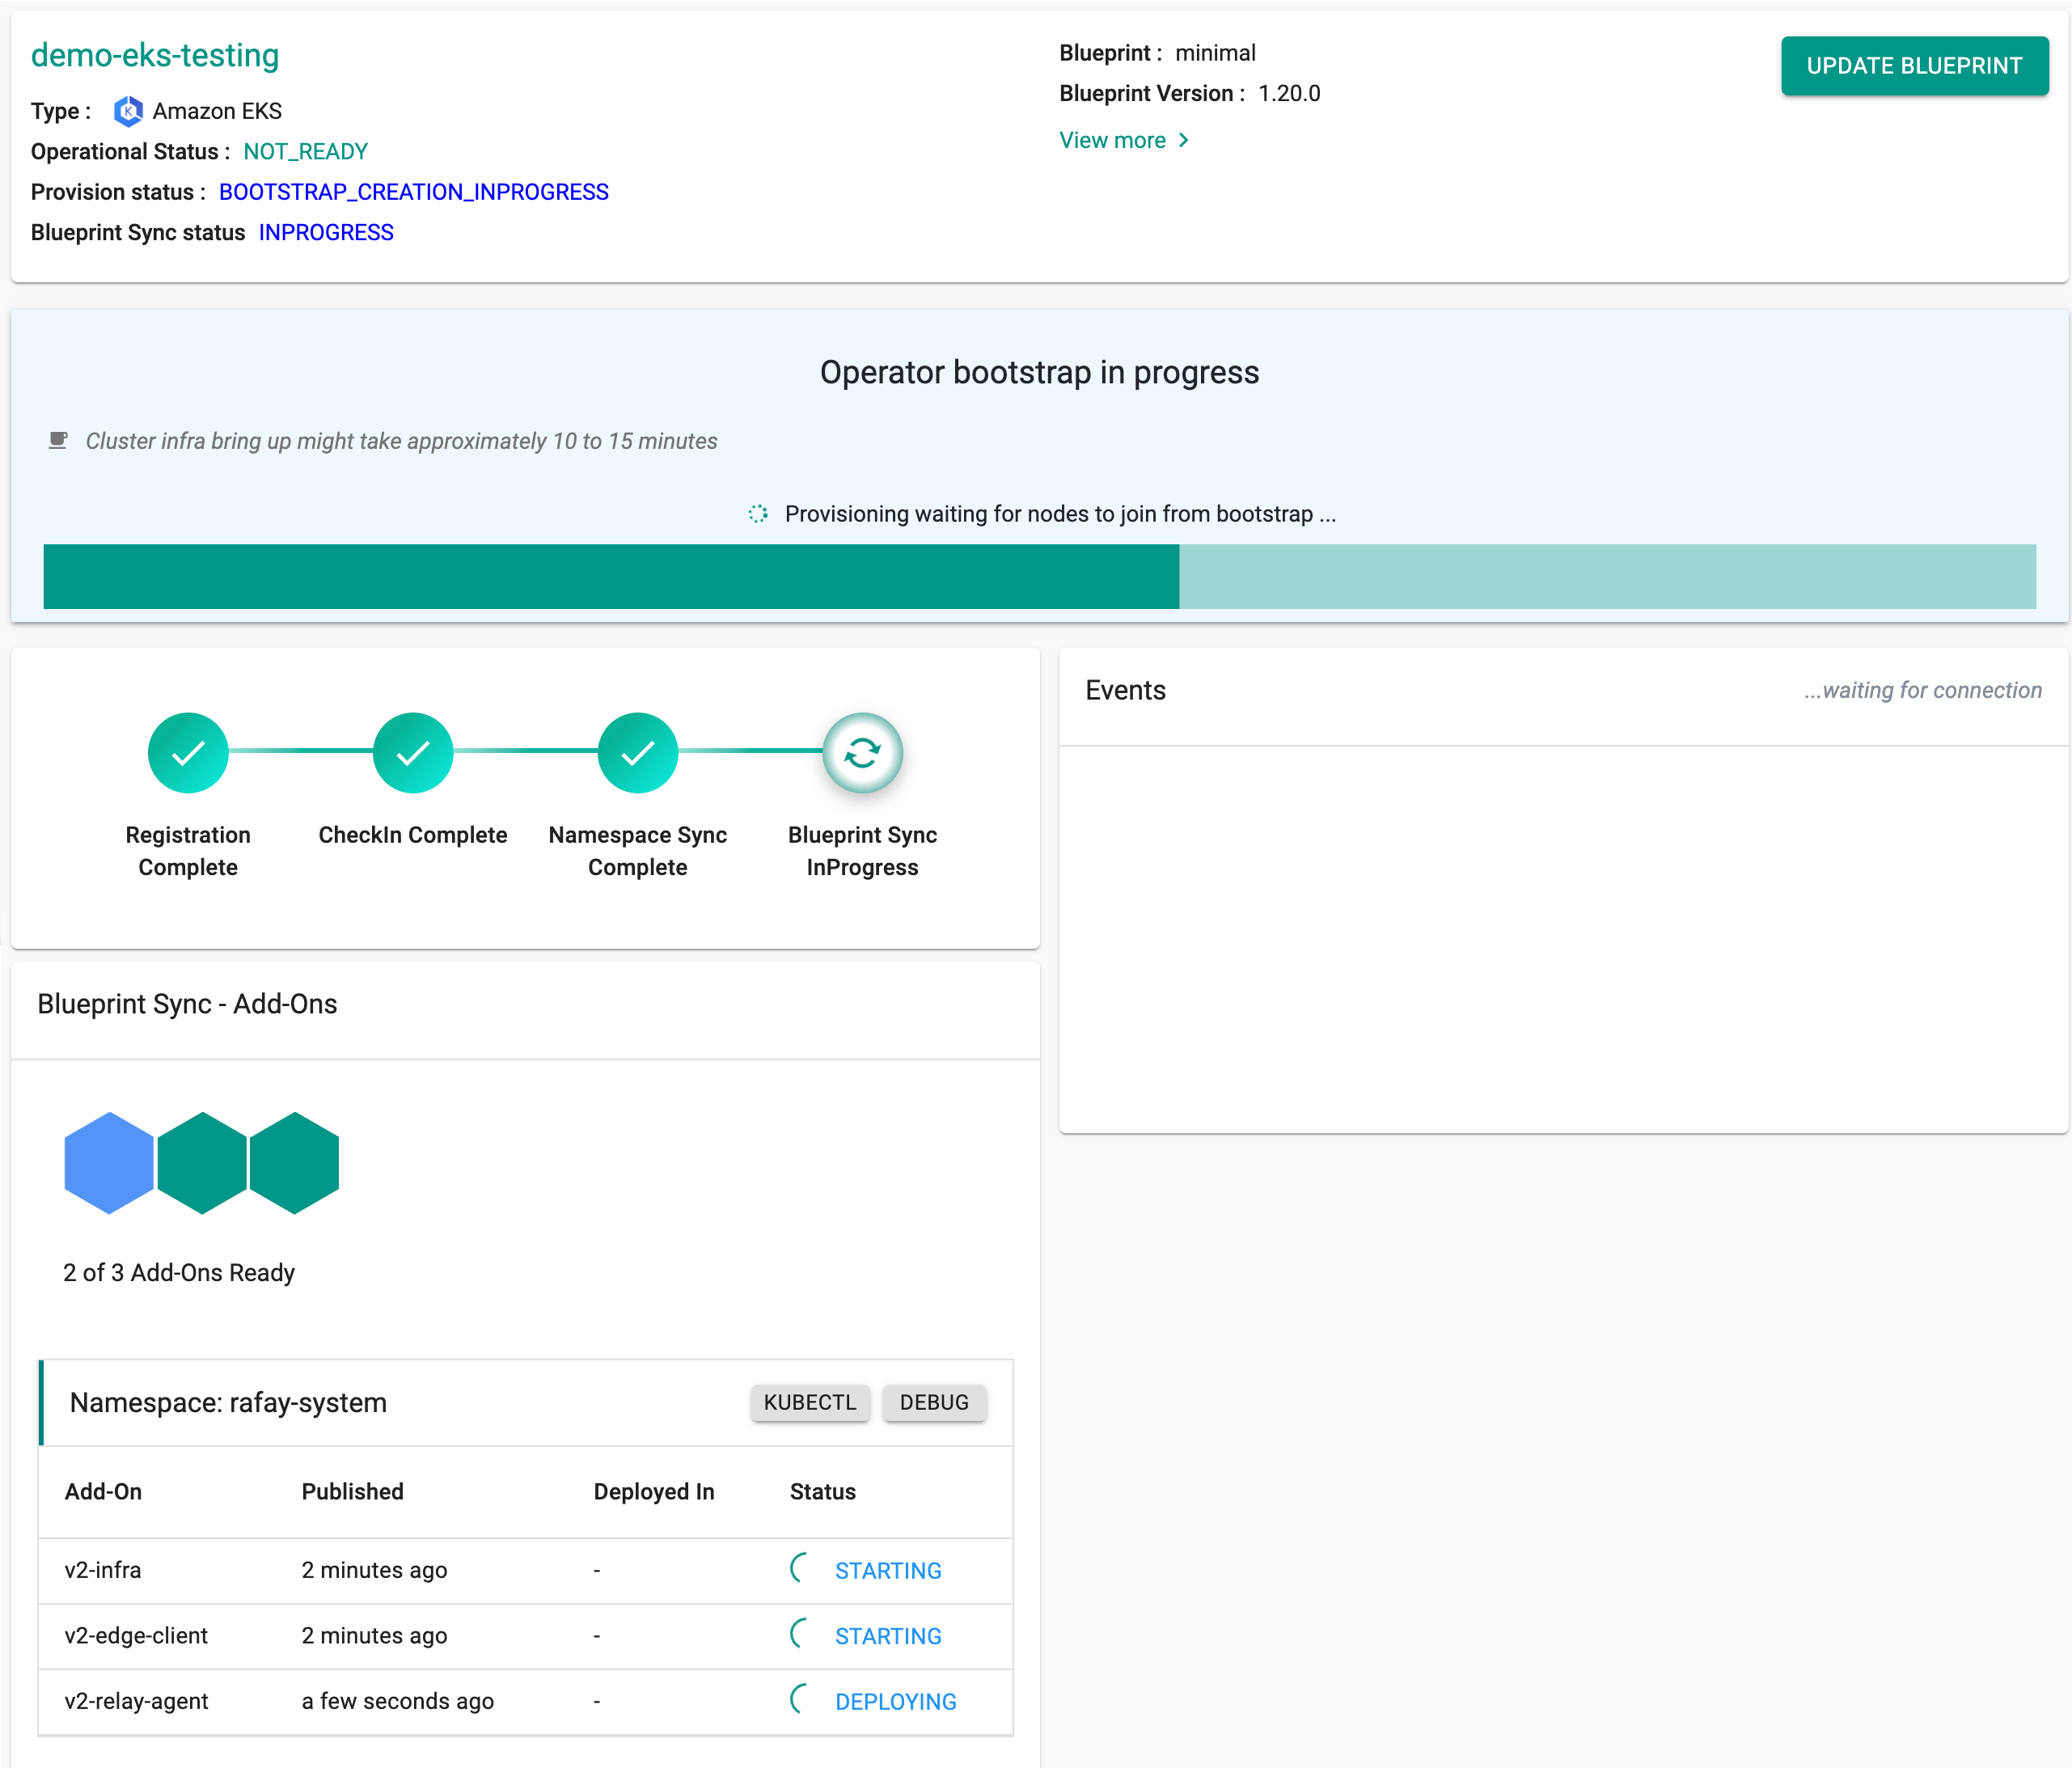
Note
It can take 30-40 minutes to fully provision the EKS Control plane, the worker nodes, the cluster blueprint's resources.
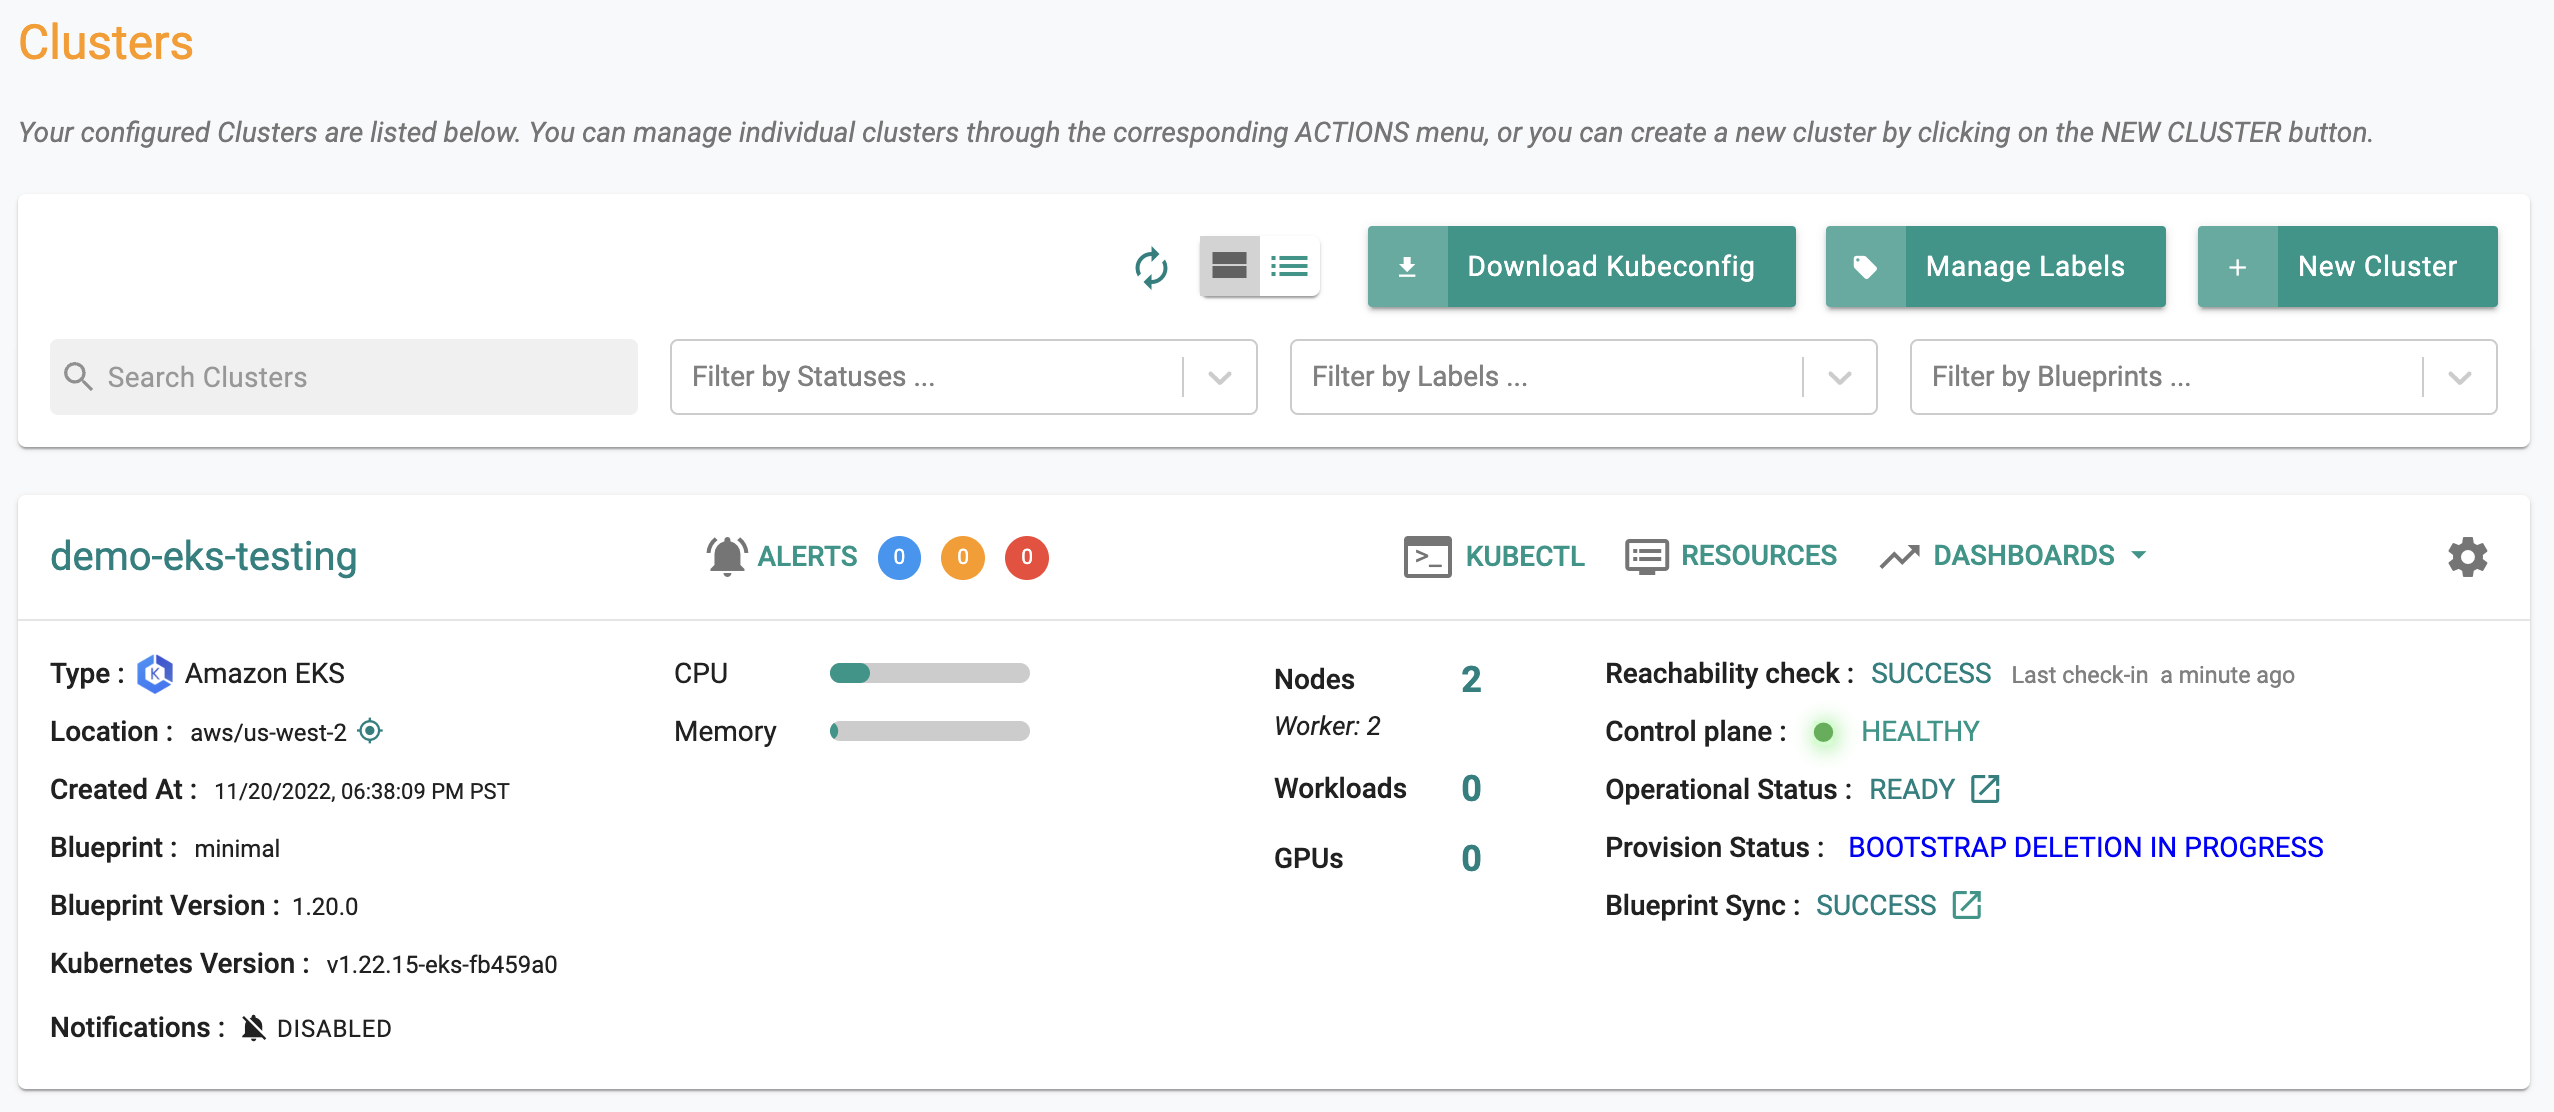
Once provisioning is complete, you should see a healthy EKS cluster with a worker node and all the resources associated with the cluster blueprint.
In this step, we will provide the RCTL CLI with a "declarative cluster specification" for our Amazon EKS Cluster. We will then use the RCTL CLI to send a suitable command to the controller to initiate provisioning or future lifecycle operations.
Save the cluster specification file below to your computer as "eks-cluster-basic.yaml"
apiVersion: infra.k8smgmt.io/v3
kind: Cluster
metadata:
  # The name of the cluster
  name: demo-eks-testing
  # The name of the project the cluster will be created in
  project: defaultproject
spec:
  blueprintConfig:
    # The name of the blueprint the cluster will use
    name: minimal
    # The version of the blueprint the cluster will use
    version: latest
  # The name of the cloud credential that will be used to create the cluster
  cloudCredentials: demo
  config:
    # The EKS addons that will be applied to the cluster
    addons:
    - name: kube-proxy
      version: latest
    - name: vpc-cni
      version: latest
    - name: coredns
      version: latest
    iam:
      # Enables the IAM OIDC provider as well as IRSA for the Amazon CNI plugin
      withOIDC: true
    managedNodeGroups:
      # The AWS AMI family type the nodes will use
    - amiFamily: AmazonLinux2
      # The desired number of nodes that can run in the node group
      desiredCapacity: 1
      # The AWS EC2 instance type that will be used for the nodes
      instanceType: t3.large
      # The maximum number of nodes that can run in the node group
      maxSize: 2
      # The minimum number of nodes that can run in the node group
      minSize: 1
      # The name of the node group that will be created in AWS
      name: ng-1
    metadata:
      # The name of the cluster
      name: demo-eks-testing
      # The AWS region the cluster will be created in
      region: us-west-2
      # The tags that will be applied to the AWS cluster resources
      tags:
        email: [email protected]
        env: qa
      # The Kubernetes version that will be installed on the cluster
      version: latest
    vpc:
      # AutoAllocateIPV6 requests an IPv6 CIDR block with /56 prefix for the VPC
      autoAllocateIPv6: false
      clusterEndpoints:
        # Enables private access to the Kubernetes API server endpoints
        privateAccess: true
        # Enables public access to the Kubernetes API server endpoints
        publicAccess: false
      # The CIDR that will be used  by the cluster VPC
      cidr: 192.168.0.0/16
  type: aws-eks
Update the following sections of the specification file with details to match your environment.
- Update the "project" with the name of your project (if you are using a different project other than defaultproject)
- Update the "cloud credentials" name
Execute the following command to provision the cluster from the specification file previously defined
./rctl apply -f eks-cluster-testing.yaml
If there are no obvious issues with the cluster specification file, the RCTL CLI will initiate provisioning and return the user with a "Task ID". The user can then use the CLI and the task id to check and monitor status.
Example Output
Cluster: demo-eks-testing
{
  "taskset_id": "d2wg4k8",
  "operations": [
    {
      "operation": "NodegroupCreation",
      "resource_name": "ng-1",
      "status": "PROVISION_TASK_STATUS_PENDING"
    },
    {
      "operation": "ClusterCreation",
      "resource_name": "demo-eks-testing",
      "status": "PROVISION_TASK_STATUS_PENDING"
    }
  ],
  "comments": "The status of the operations can be fetched using taskset_id",
  "status": "PROVISION_TASKSET_STATUS_PENDING"
}
To retrieve the status of the CLI operation, enter the below command with the generated "task id"
./rctl status apply <d2wg4k8>
This should provide with current status of the operation. An illustrative example is shown below.
{
  "taskset_id": "d2wg4k8",
  "operations": [
    {
      "operation": "NodegroupCreation",
      "resource_name": "ng-1",
      "status": "PROVISION_TASK_STATUS_PENDING"
    },
    {
      "operation": "ClusterCreation",
      "resource_name": "demo-eks-testing",
      "status": "PROVISION_TASK_STATUS_INPROGRESS"
    }
  ],
  "comments": "Configuration is being applied to the cluster",
  "status": "PROVISION_TASKSET_STATUS_INPROGRESS"
}
Make sure the following are installed or available.
- Terraform
- Text editor (or ability to update files using a terminal)
Make sure you have the following information. You may need to create these in your AWS environment or in the console.
To provision a cluster using Terraform:
- Download and decompress the Get Started package. Navigate to the
/terraform/eksfolder. - Edit the
config.jsonfile. The file location is /terraform/artifacts/credentials/config.json. For this exercise, just change the following.api_key- Use the console API key.api_secret- Use the console API secret.project_id- Download the CLI Config file from the console and open the file with a text editor.
- Edit the
terraform.tfvarsfile. The file location is /terraform/terraform.tfvars. For this exercise, just update the following.rolearnexternalidcluster_locationk8s_version
- Open the terminal or command line.
- Navigate to the
terraformfolder. - Run
terraform init.- Initializes the directory containing the Terraform configuration files, preparing the directory for use with Terraform.
- Run
terraform validate.- Validates the configuration files in the directory, without accessing any remote services.
- Run
terraform apply. Enteryeswhen prompted. -Provisions the cluster.
It can take 20 minutes to provision the cluster. Check the console for the provisioning status.
Step 3: Zero Trust Kubectl
Important
Provisionioning an EKS cluster's control plane, configured nodes and applying the cluster blueprint can take 30-40 mins of time.
In the cluster specification, we specified our Amazon EKS Cluster's API Server to be private and secure (i.e. cloaked and not directly reachable on the Internet).
Once provisioning is complete and the cluster blueprint has been synchronized, we will attempt to perform Kubectl operations against our "cloaked" EKS cluster operating "behind a firewall".
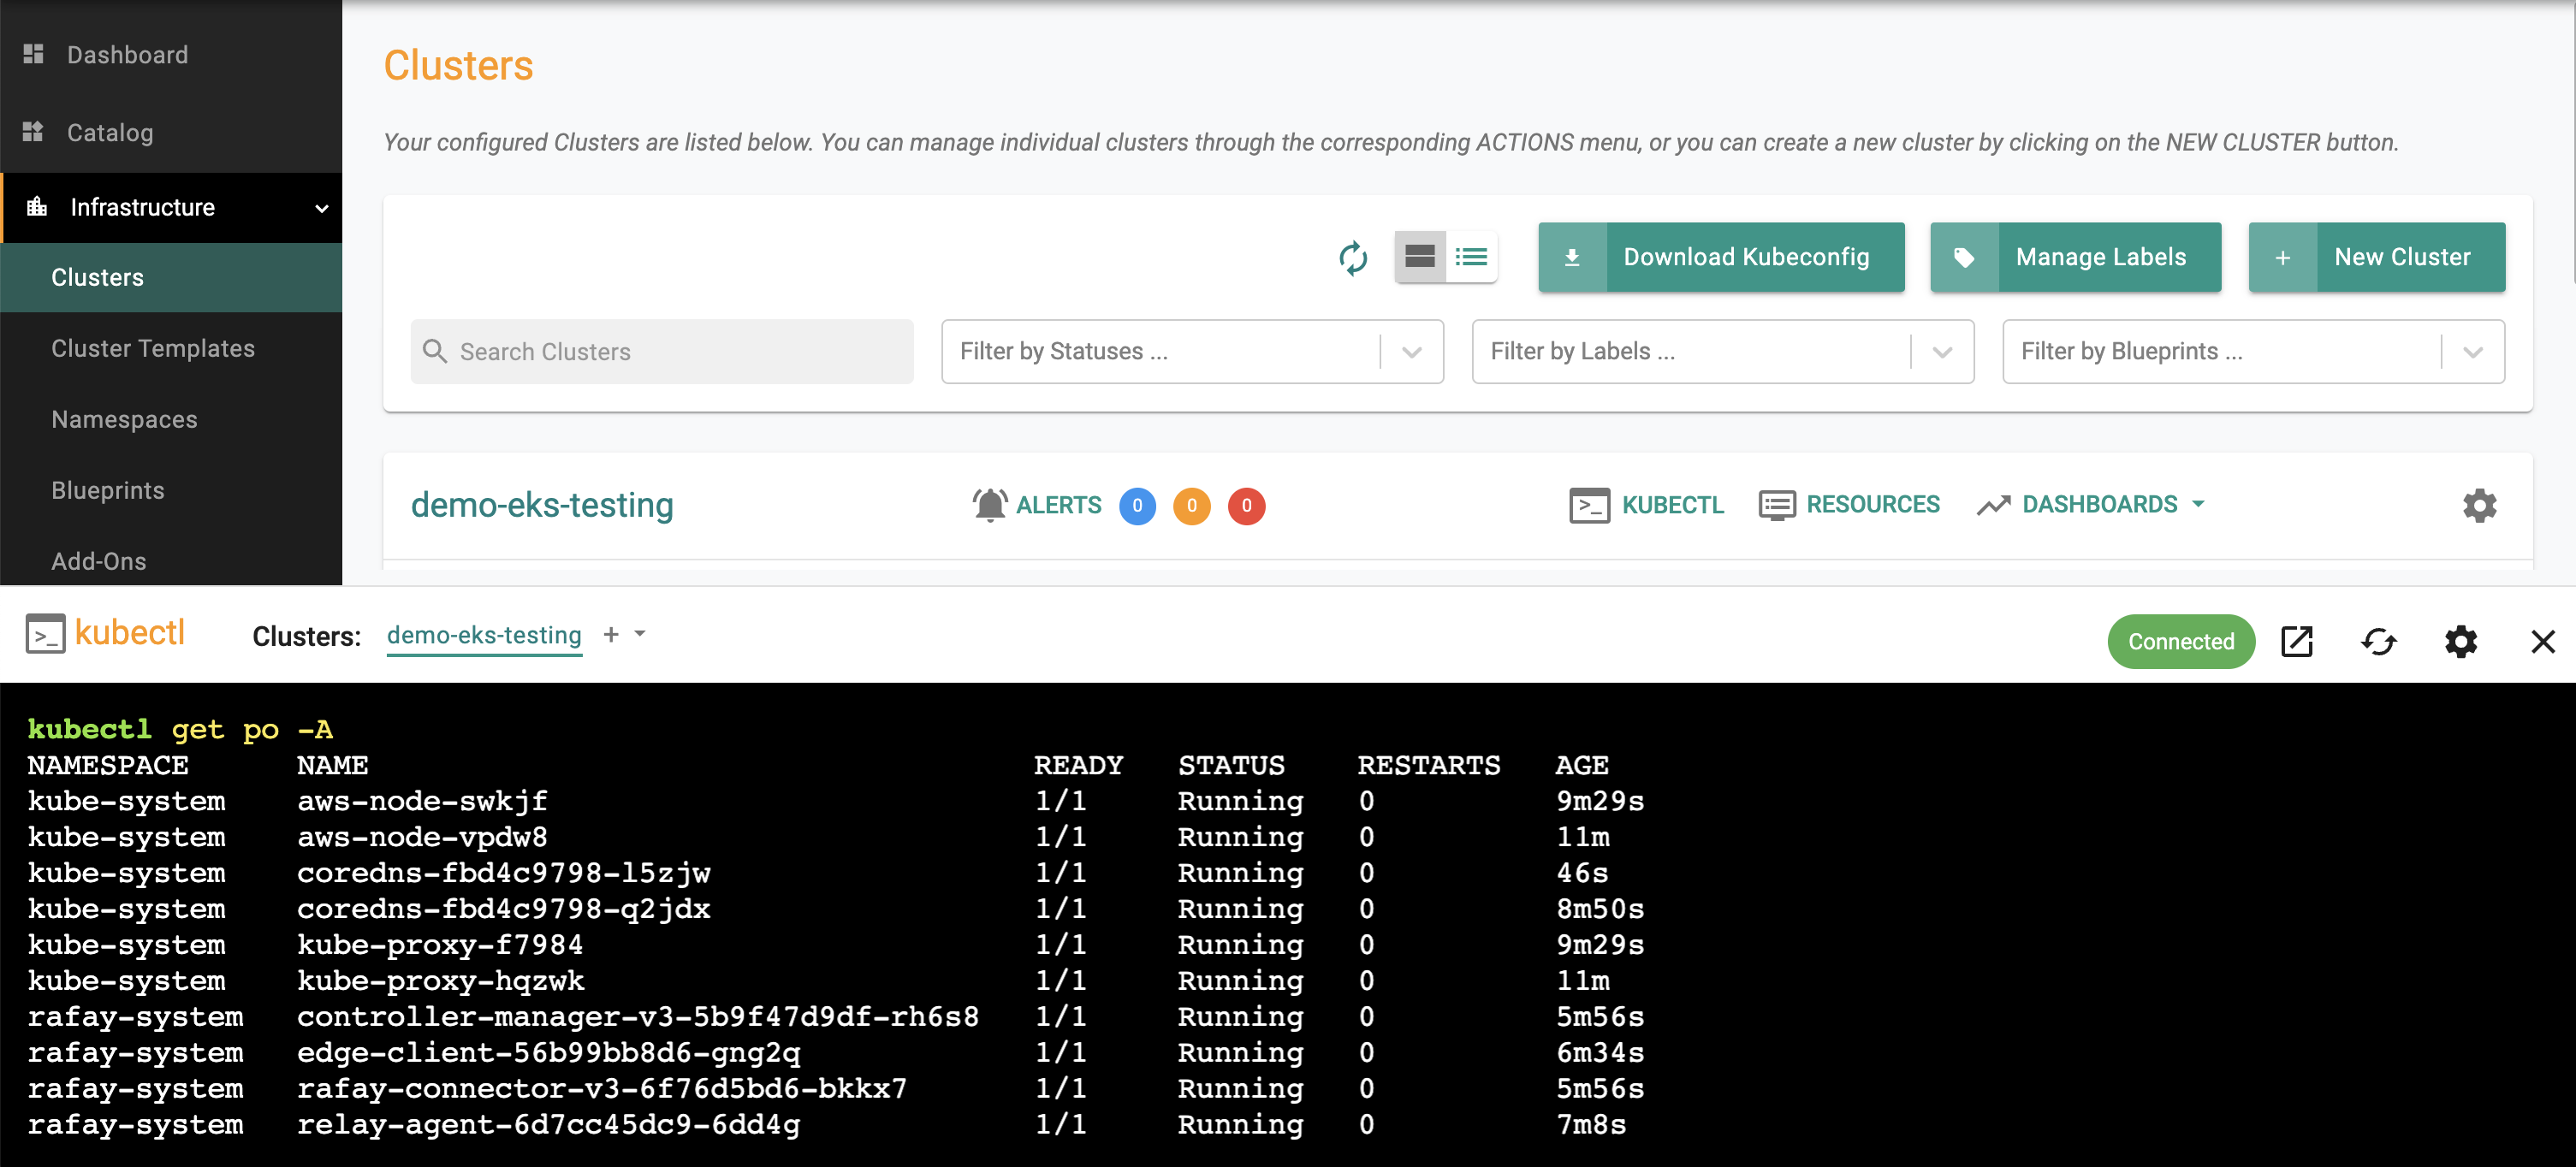
The controller provides a zero trust kubectl channel for authorized users.
- Navigate to the EKS Cluster Card in the project where you provisioned the EKS Cluster
- Click on the "Kubectl" link
- This will launch a web based shell for you to securely interact with the API server over a zero trust channel
- Type a kubectl command such as "kubectl get po -A" to list the pods in ALL the namespaces in your EKS cluster
- You should see something like the following example.
Note
Learn more about Zero Trust Access.
Step 4: Kubernetes Resource Dashboards
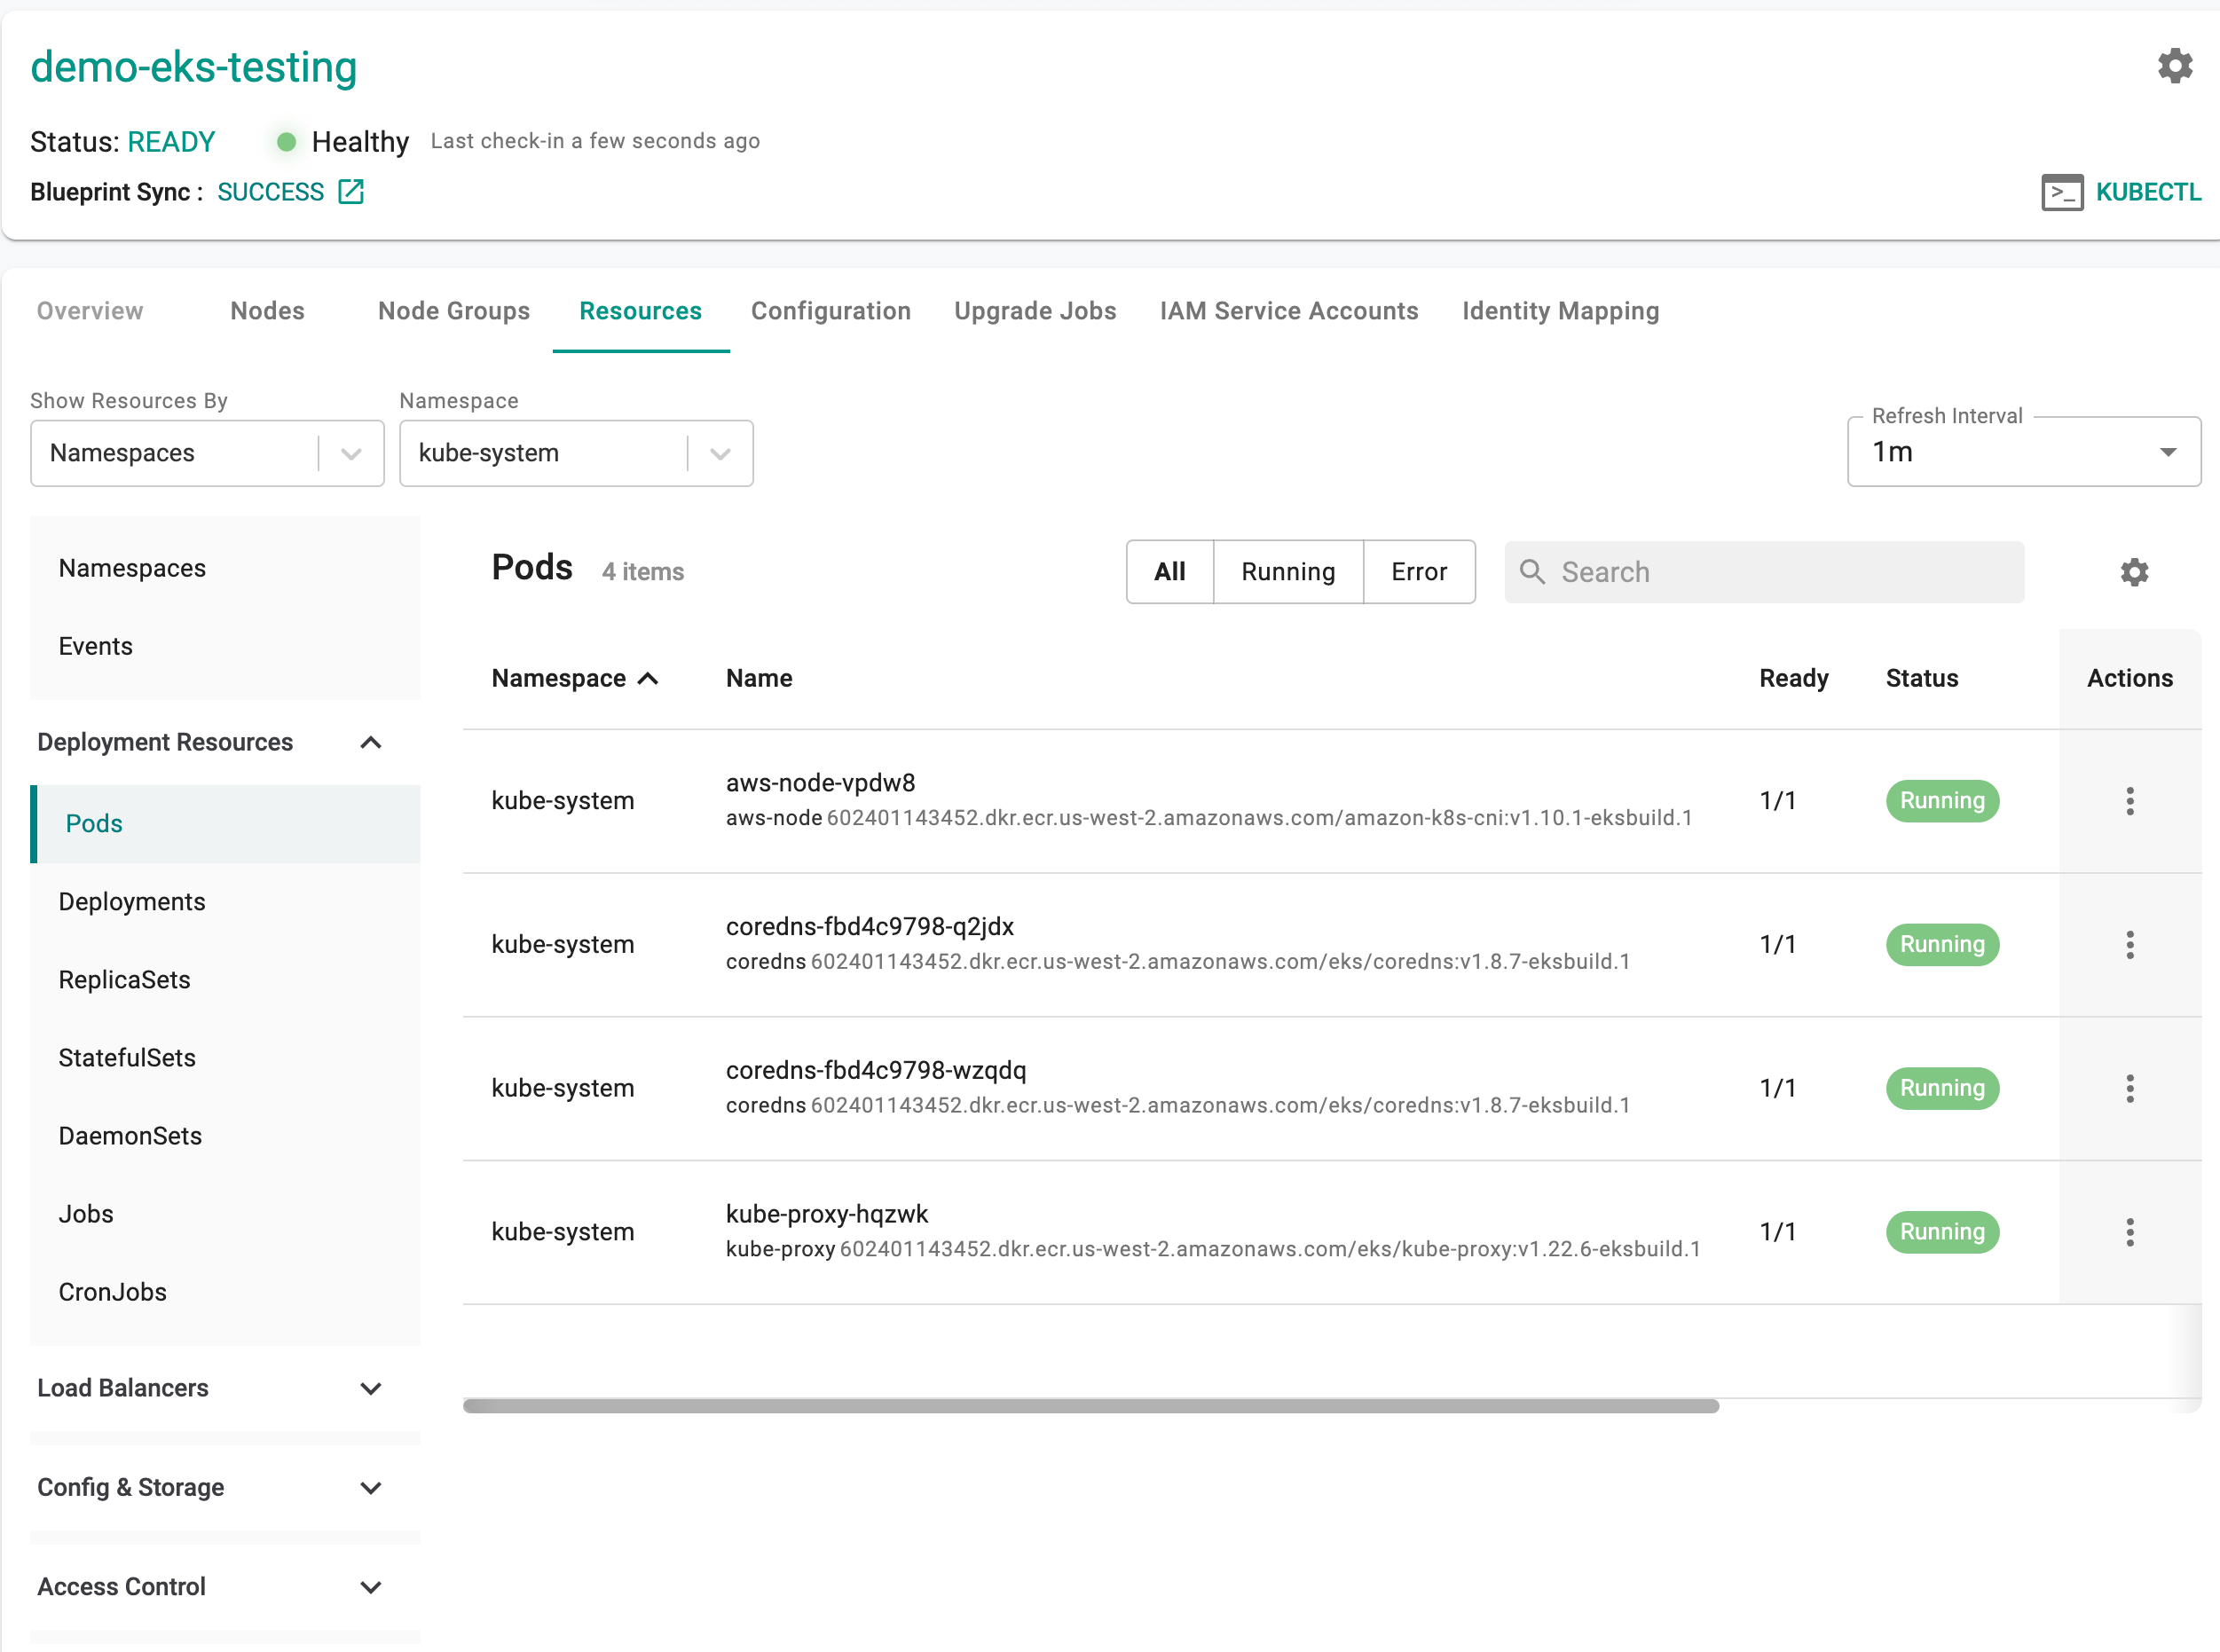
The cluster dashboard also comes with an integrated "Kubernetes Resources" dashboard.
- Click on "Resources" on the cluster card and in a few seconds, all the Kubernetes resources, their status etc is retrieved in near real time and presented to the user. You should see something like the screenshot below.
Note
Learn more about the Integrated Kubernetes Dashboard.
Recap
Congratulations! At this point, you have
- Successfully configured and provisioned an Amazon EKS cluster in your AWS account using the controller
- Used the zero trust kubectl service to securely interact with the EKS cluster's API server
- Used the integrated Kubernetes resources dashboard to view the resources operational on the cluster.