GPU Dashboard
Use the GPU Resource Dashboard once NVIDIA GPU Operator is deployed. NVIDIA GPU Operator deployment automates the management of all NVIDIA software components, which are required to provision GPUs within Kubernetes. The GPU Resource Dashboard is powered by the dcgmExporter deployed as part of the GPU Operator, and it gives deeper visibility into the resources of your GPU cores.
Important
Please read through the multi part blog series describing which GPU metrics, why and how to use them.
| Part | Description |
|---|---|
| Intro | Introduction to GPU metrics and why they are important. |
| Memory Utilization Metric | Detailed discussion on GPU memory utilization and its impact. |
| SM Clock Metric | Explanation of the SM clock metric and its importance. |
| Power Metric | Insights on GPU power metrics and their role in performance. |
| Framebuffer Metric | Insights on framebuffer usage and its impact to performance |
How it Works
The Rafay managed Prometheus automatically scrapes the GPU metrics (if available) and aggregates them in a multi-tenant, time series database on the controller. The diagram below describes the process at a high level.
sequenceDiagram
autonumber
participant user as Data Scientist
participant rafay as Rafay SaaS
box Kubernetes Cluster in Remote Datacenter
participant prom as Managed Prometheus
participant operator as GPU Operator
participant gpu as Nvidia GPU
end
operator->>gpu: Retrieve GPU Metrics
prom->>operator: Scrape GPU Metrics
prom->>rafay: Aggregate Metrics
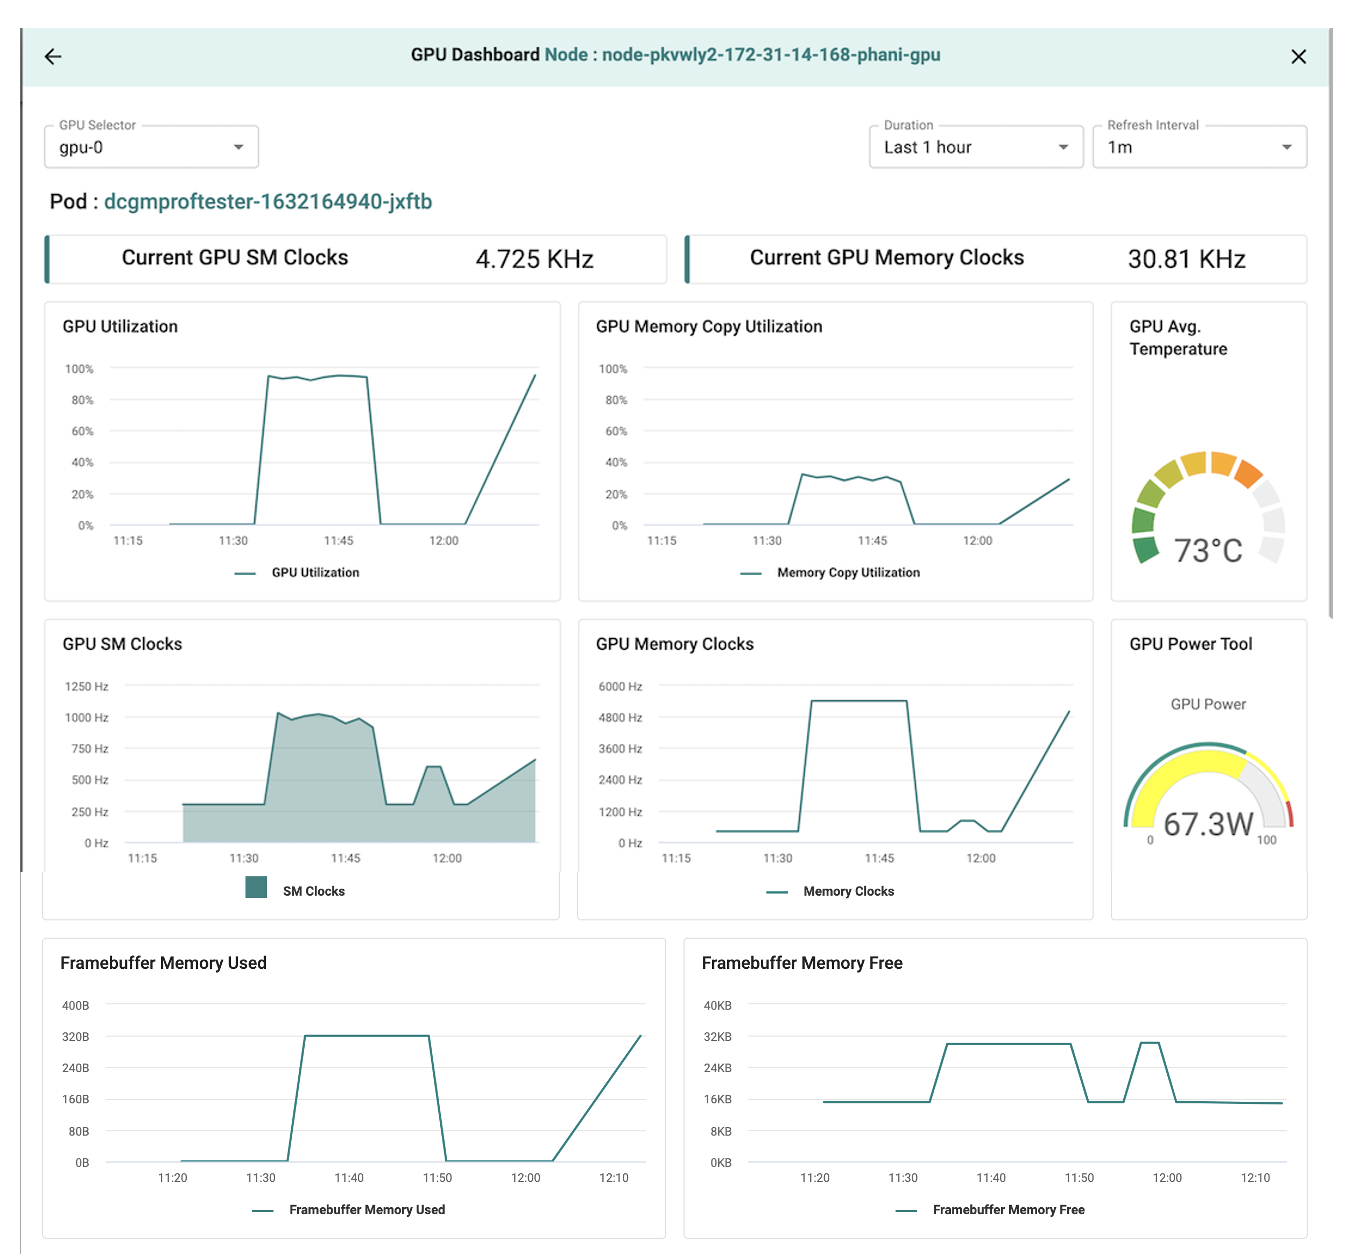
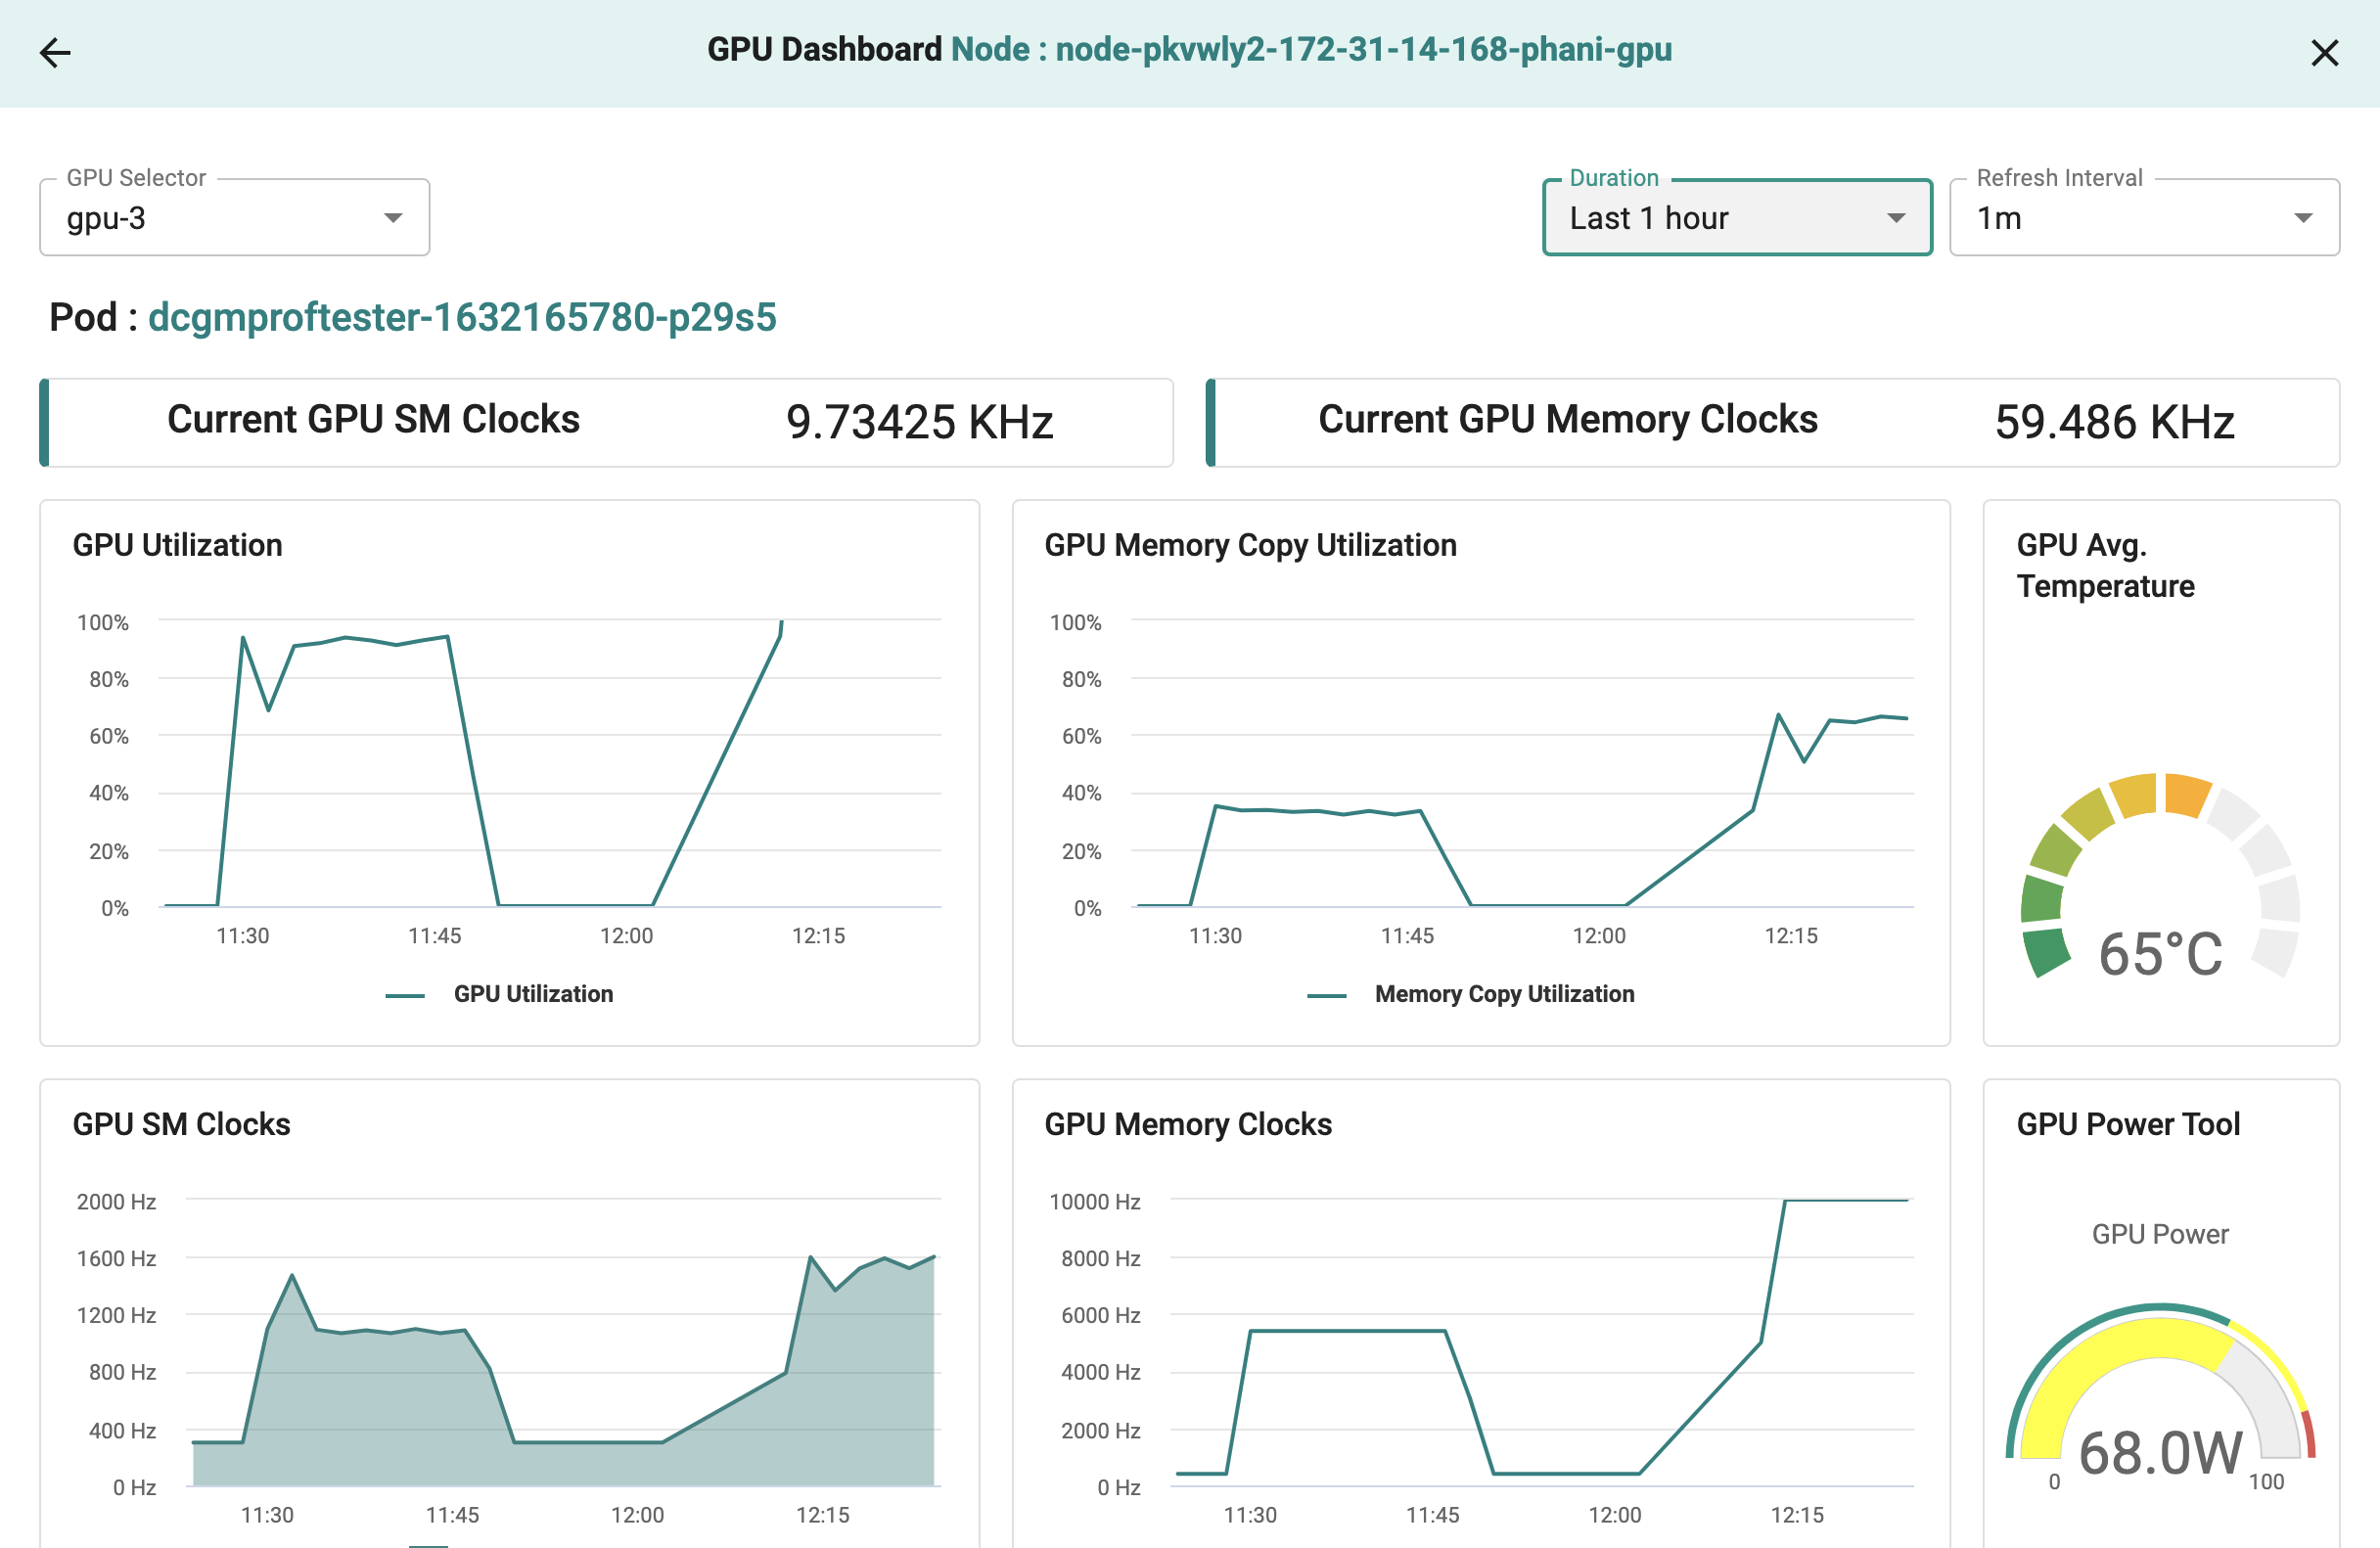
user->>rafay: Access/View GPU MetricsThe GPU Dashboard contains the graph of current GPU SM Clocks, Current GPU Memory Clocks, GPU Utilization, GPU Memory Copy Utilization, GPU SM Clocks, GPU Memory Clocks, Framebuffer Memory Used, Framebuffer Memory Free, GPU Average Temperature, and GPU Power Tool
Access a specific GPU core dashboard with the following options:
From Cluster Card
Click on GPUs count in the Cluster card of the project to view a list of all GPU cores of the cluster, the node they belong to and the pods using GPU cores
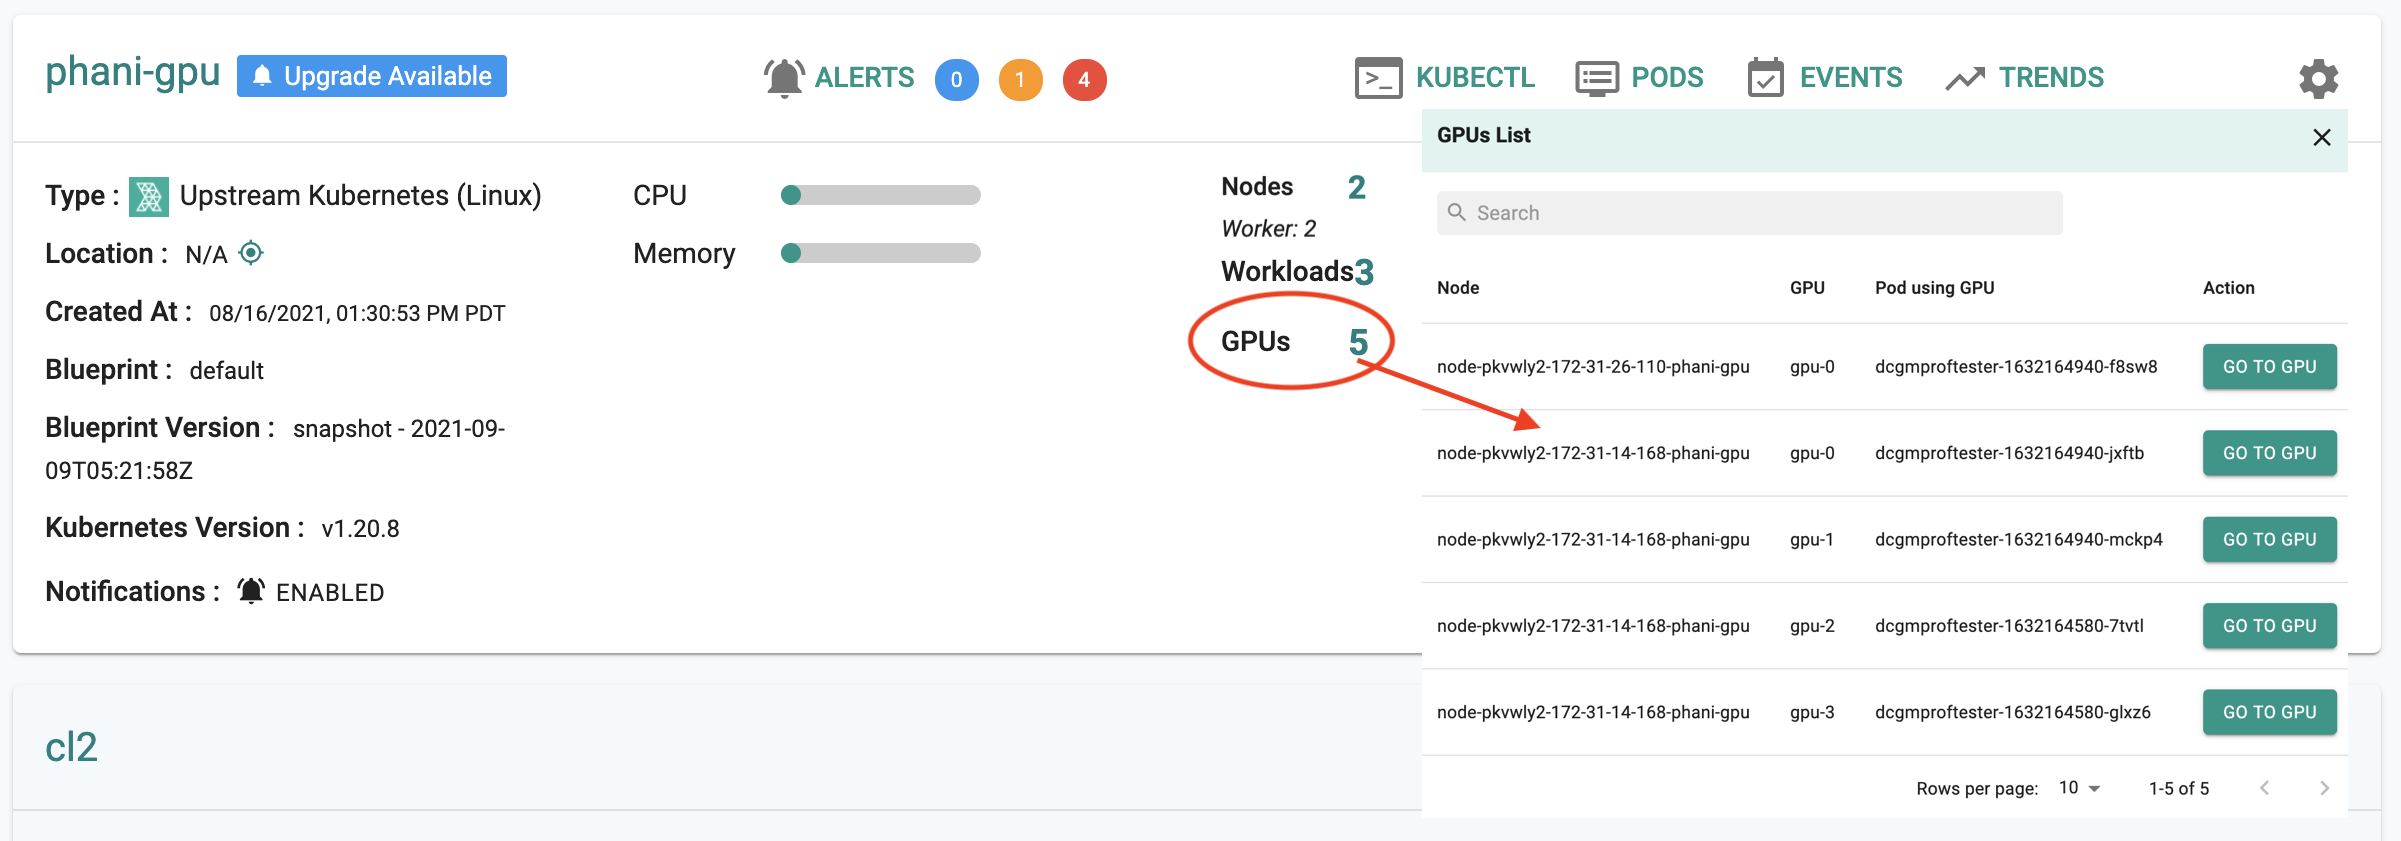
From the GPU core list, click node GPU core to view the GPU dashboard for that specific GPU core
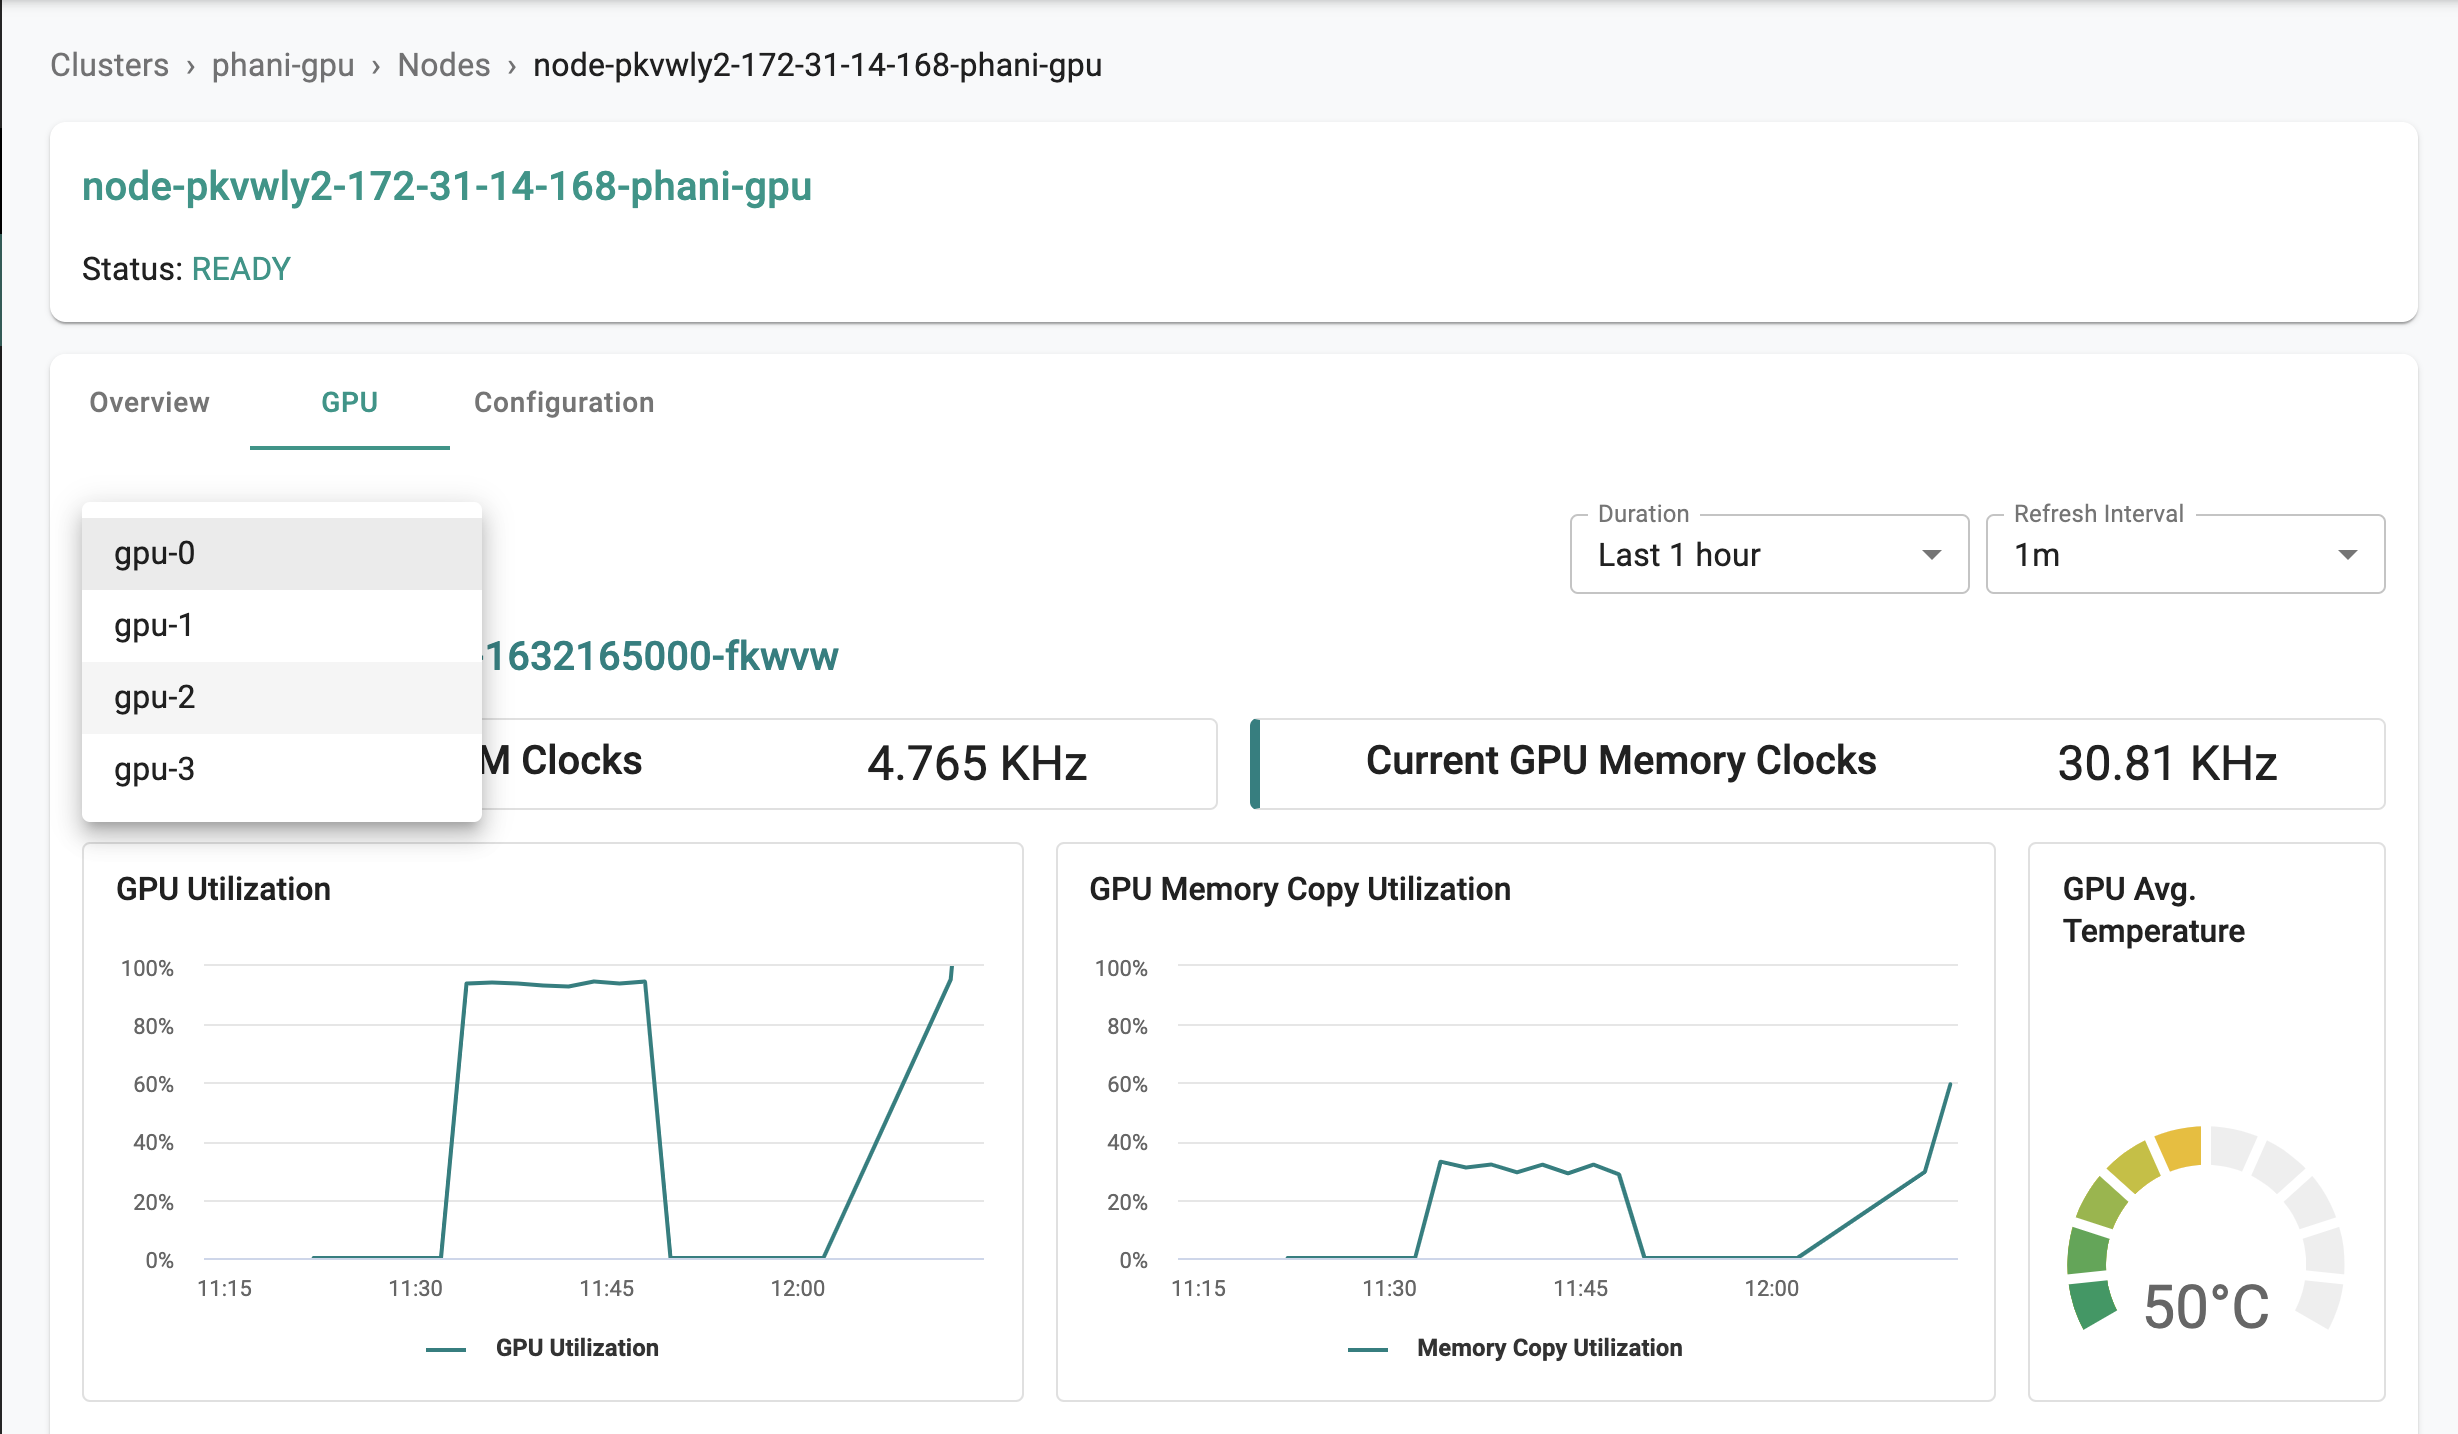
From Node Dashboard
From the Node's dashboard, click GPU tab and select the GPU core in the drop down list to view the GPU dashboard for that specific GPU core.