Pod Dashboard
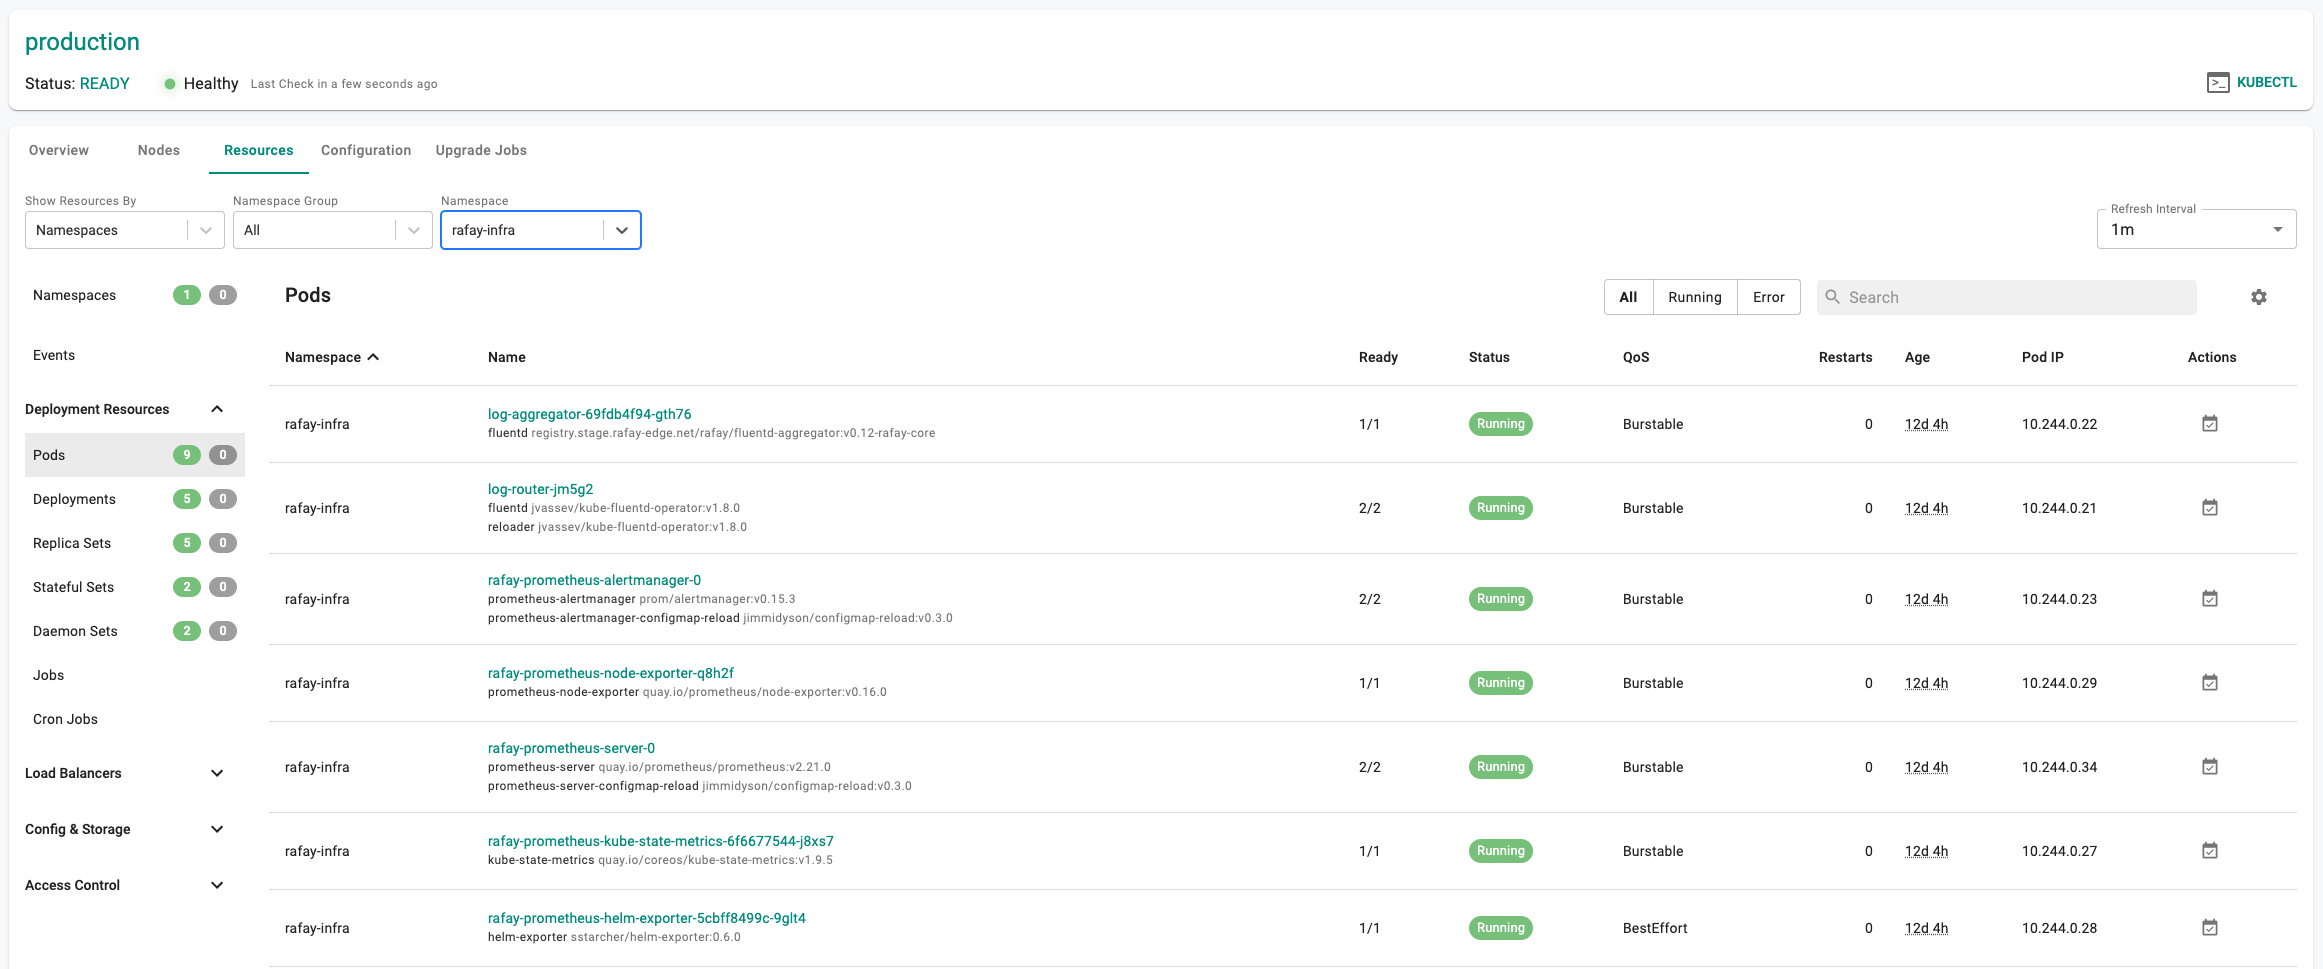
The Web Console also provides users with a detailed visibility into every pod on the cluster. Click on the "pod name" to access the Pod Dashboard. An illustrative example is shown below.
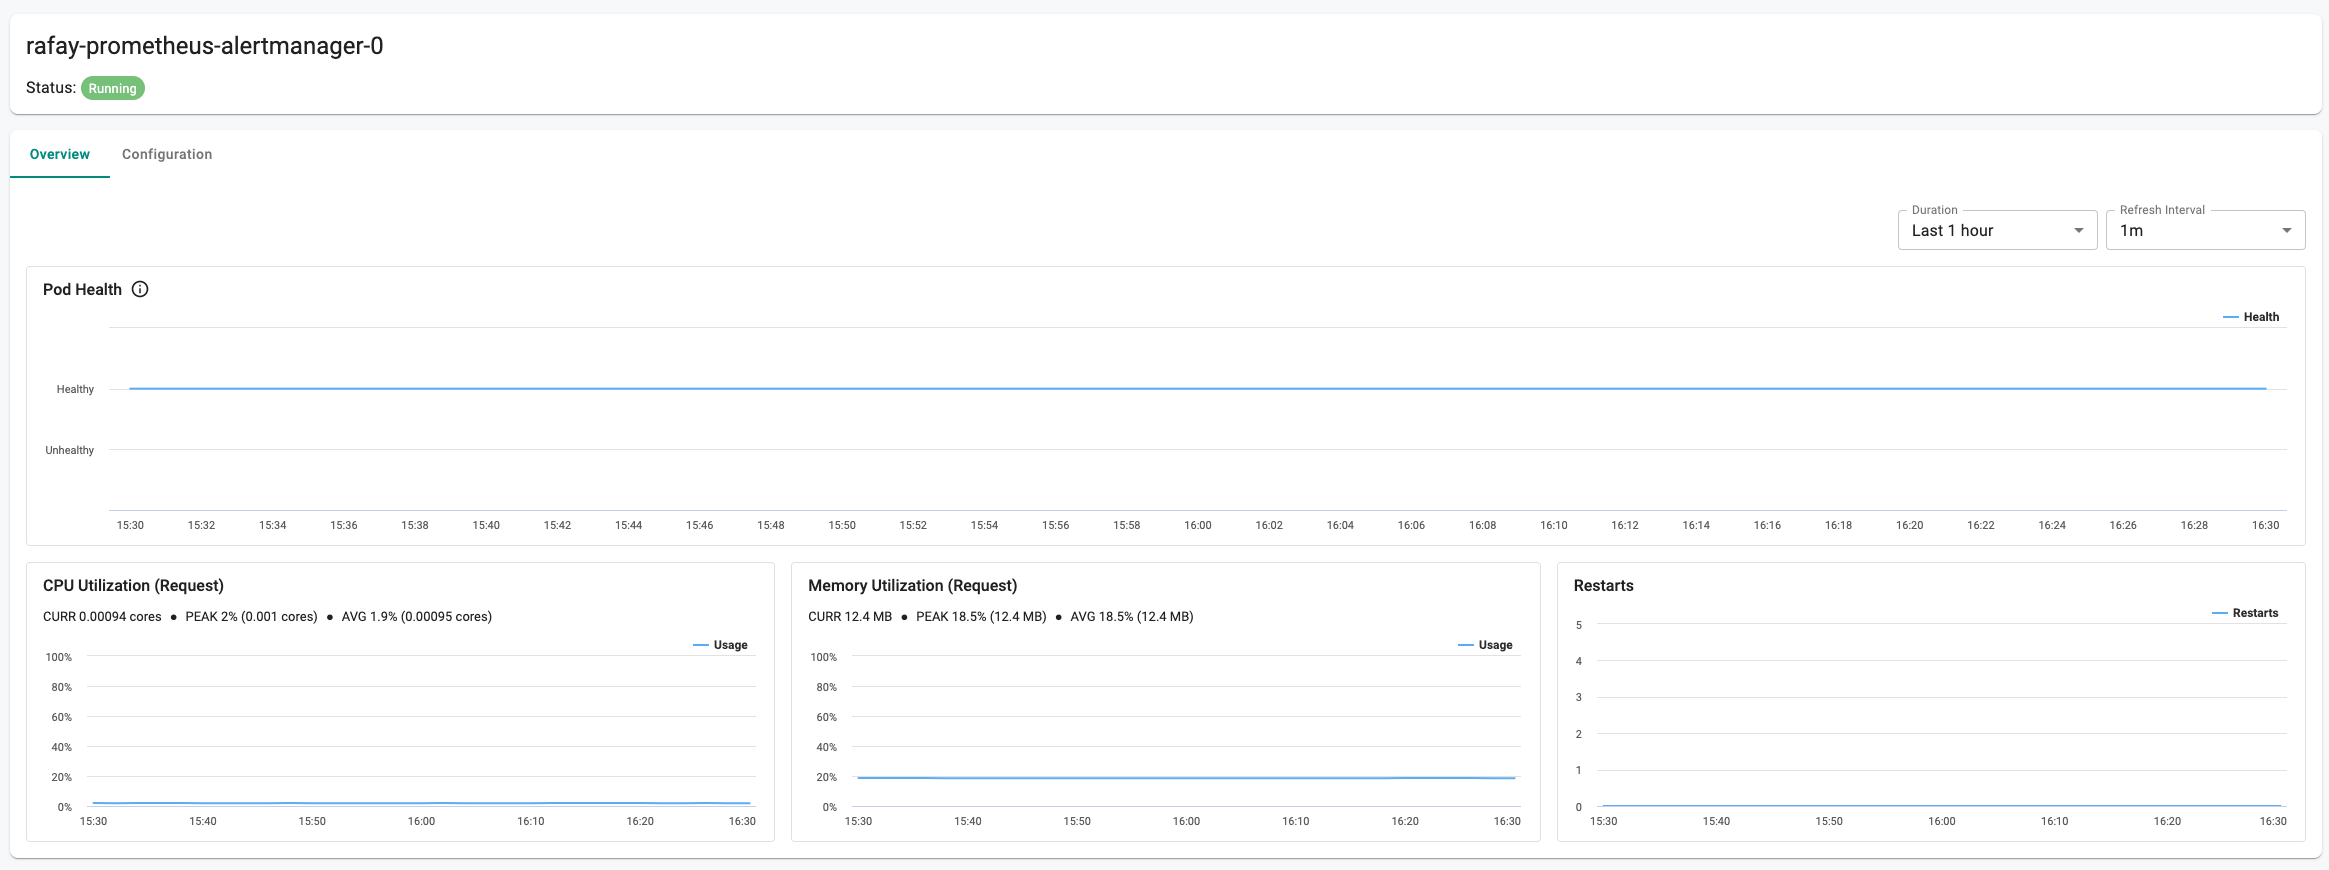
Pod Dashboard
The Pod Dashboard provides deep visibility into both the current state and long term trends. In addition, users will also have visibility into the pod specs and configuration.
Pod Overview
A health timeline is shown to the user providing a view into how the pod has fared during the specified time period.
In addition to resource (CPU and Memory) utilization trends, the user is also shown the pod restart count since the pod was scheduled on the cluster.
Pod CPU Usage
To check Pod CPU Usage, follow these steps:
- Log in to the Rafay Console and click on the Kubectl button for the desired cluster.
- Run the command
kubectl top pod -A. This will display the Pod CPU usage details as shown below.
kubectl top pod -A
NAMESPACE      NAME                                                   CPU(cores)   MEMORY(bytes)
kube-system    aws-node-d69b5                                         4m           58Mi
kube-system    aws-node-gl6hc                                         4m           58Mi
kube-system    coredns-54d45b7485-cwl95                               2m           12Mi
kube-system    coredns-54d45b7485-xvbph                               2m           13Mi
kube-system    ebs-csi-controller-7455d54996-6cl2r                    4m           60Mi
kube-system    ebs-csi-controller-7455d54996-t5m87                    2m           50Mi
kube-system    ebs-csi-node-sptjx                                     1m           21Mi
kube-system    ebs-csi-node-xs6ld                                     1m           21Mi
kube-system    kube-proxy-98krh                                       1m           11Mi
kube-system    kube-proxy-sdgjh                                       1m           11Mi
rafay-infra    aws-node-termination-handler-v3-959kp                  1m           11Mi
rafay-infra    aws-node-termination-handler-v3-jlwlt                  1m           11Mi
rafay-infra    rafay-prometheus-adapter-568d489fff-6k8tw              12m          46Mi
rafay-infra    rafay-prometheus-alertmanager-0                        2m           15Mi
rafay-infra    rafay-prometheus-helm-exporter-7c6ff6796b-v7hm4        2m           16Mi
rafay-infra    rafay-prometheus-kube-state-metrics-5fb94885db-72gs2   1m           11Mi
rafay-infra    rafay-prometheus-metrics-server-5668dc889d-77dhf       2m           18Mi
rafay-infra    rafay-prometheus-node-exporter-2k58n                   1m           7Mi
rafay-infra    rafay-prometheus-node-exporter-s25mf                   1m           7Mi
rafay-infra    rafay-prometheus-server-0                              21m          129Mi
rafay-system   controller-manager-v3-55db58898-ldl94                  2m           42Mi
rafay-system   edge-client-5966bf85b4-wd5j6                           1m           77Mi
rafay-system   ingress-controller-v1-controller-2jg8d                 2m           57Mi
rafay-system   ingress-controller-v1-controller-g2lt9                 2m           57Mi
rafay-system   rafay-connector-v3-7dcb4d8cb4-cjmbb                    3m           118Mi
rafay-system   v2-relay-agent-5cc9676cbc-kw54n                        4m           84Mi
Important
If the Metric API server is not deployed on the cluster, CPU usage data will not be available.
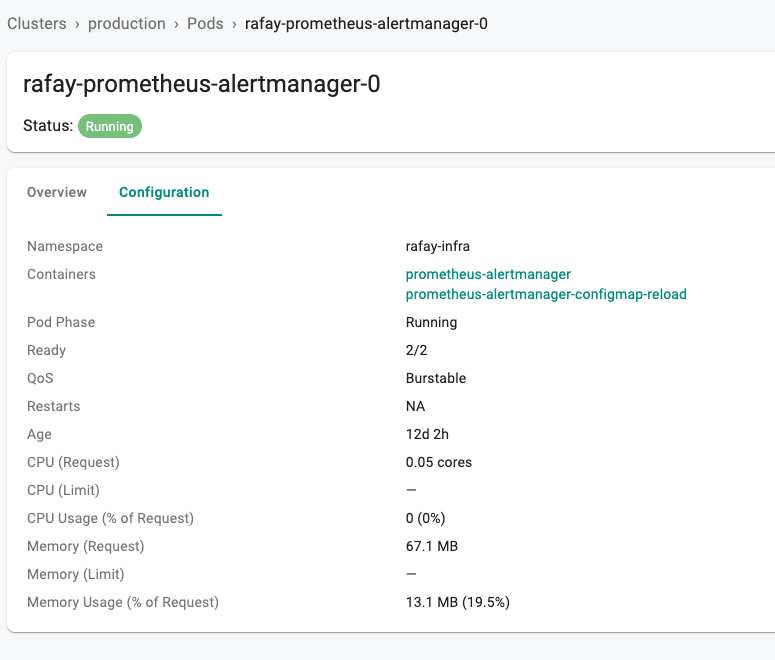
Pod Configuration
Click on "Configuration" to view detailed configuration for the Pod. An illustrative example is shown below where there are two containers in the pod. Clicking on a container will take the user to the container's dashboard.