Access
In this part, you will
- Create an IRSA for Grafana to read from the AMP workspace.
- Configure and Deploy a Grafana workload to your EKS cluster.
- Access the Grafana dashboard to view the aggregated metrics from the AMP workspace.
Step 1: IRSA
In this step, you will create an IRSA so that Grafana on the EKS cluster will have the necessary permissions to perform "remote reads" from the AMP query endpoint. In AWS, it is a recommended best practice to use IAM roles for service accounts (IRSA) to access AWS services outside the EKS cluster.
Create Namespace
We will deploy Prometheus to a namespace called "grafana"
- Click on Infrastructure -> Namespace.
- Create a new namespace with the name "grafana".
Create IRSA
In the example below, the EKS cluster's name is "amp-demo" and the IRSA name is "grafana-amp-irsa".
./rctl create iam-service-account amp-demo --name grafana-irsa --namespace grafana --policy-arn arn:aws:iam::aws:policy/AmazonPrometheusQueryAccess

Request submitted successfully to create IAM service account(s).
Verify IRSA
Creation of the IRSA can take a few seconds. You can verify the status of the IRSA by using RCTL
./rctl get iam-service-account amp-demo --namespace grafana

[{"metadata":{"name":"grafana-irsa","namespace":"grafana"},"attachPolicyARNs":["arn:aws:iam::aws:policy/AmazonPrometheusQueryAccess"]}]
You can also verify that the k8s service account was created in the EKS cluster in the "grafana" namespace.
- Click on the Zero Trust Kubectl Shell on the web console.
kubectl get sa -n grafana

NAME           SECRETS   AGE
default        1         56s
grafana-irsa   1         56s
As you can see in this example, the "grafana-irsa" service account was successfully created in the "grafana" namespace.
Step 2: Grafana
In this step, we will configure and deploy a Grafana workload to the EKS Cluster. We will use a custom values.yaml file which will incorporate the IRSA for Grafana from the prior step.
Add Grafana Repo
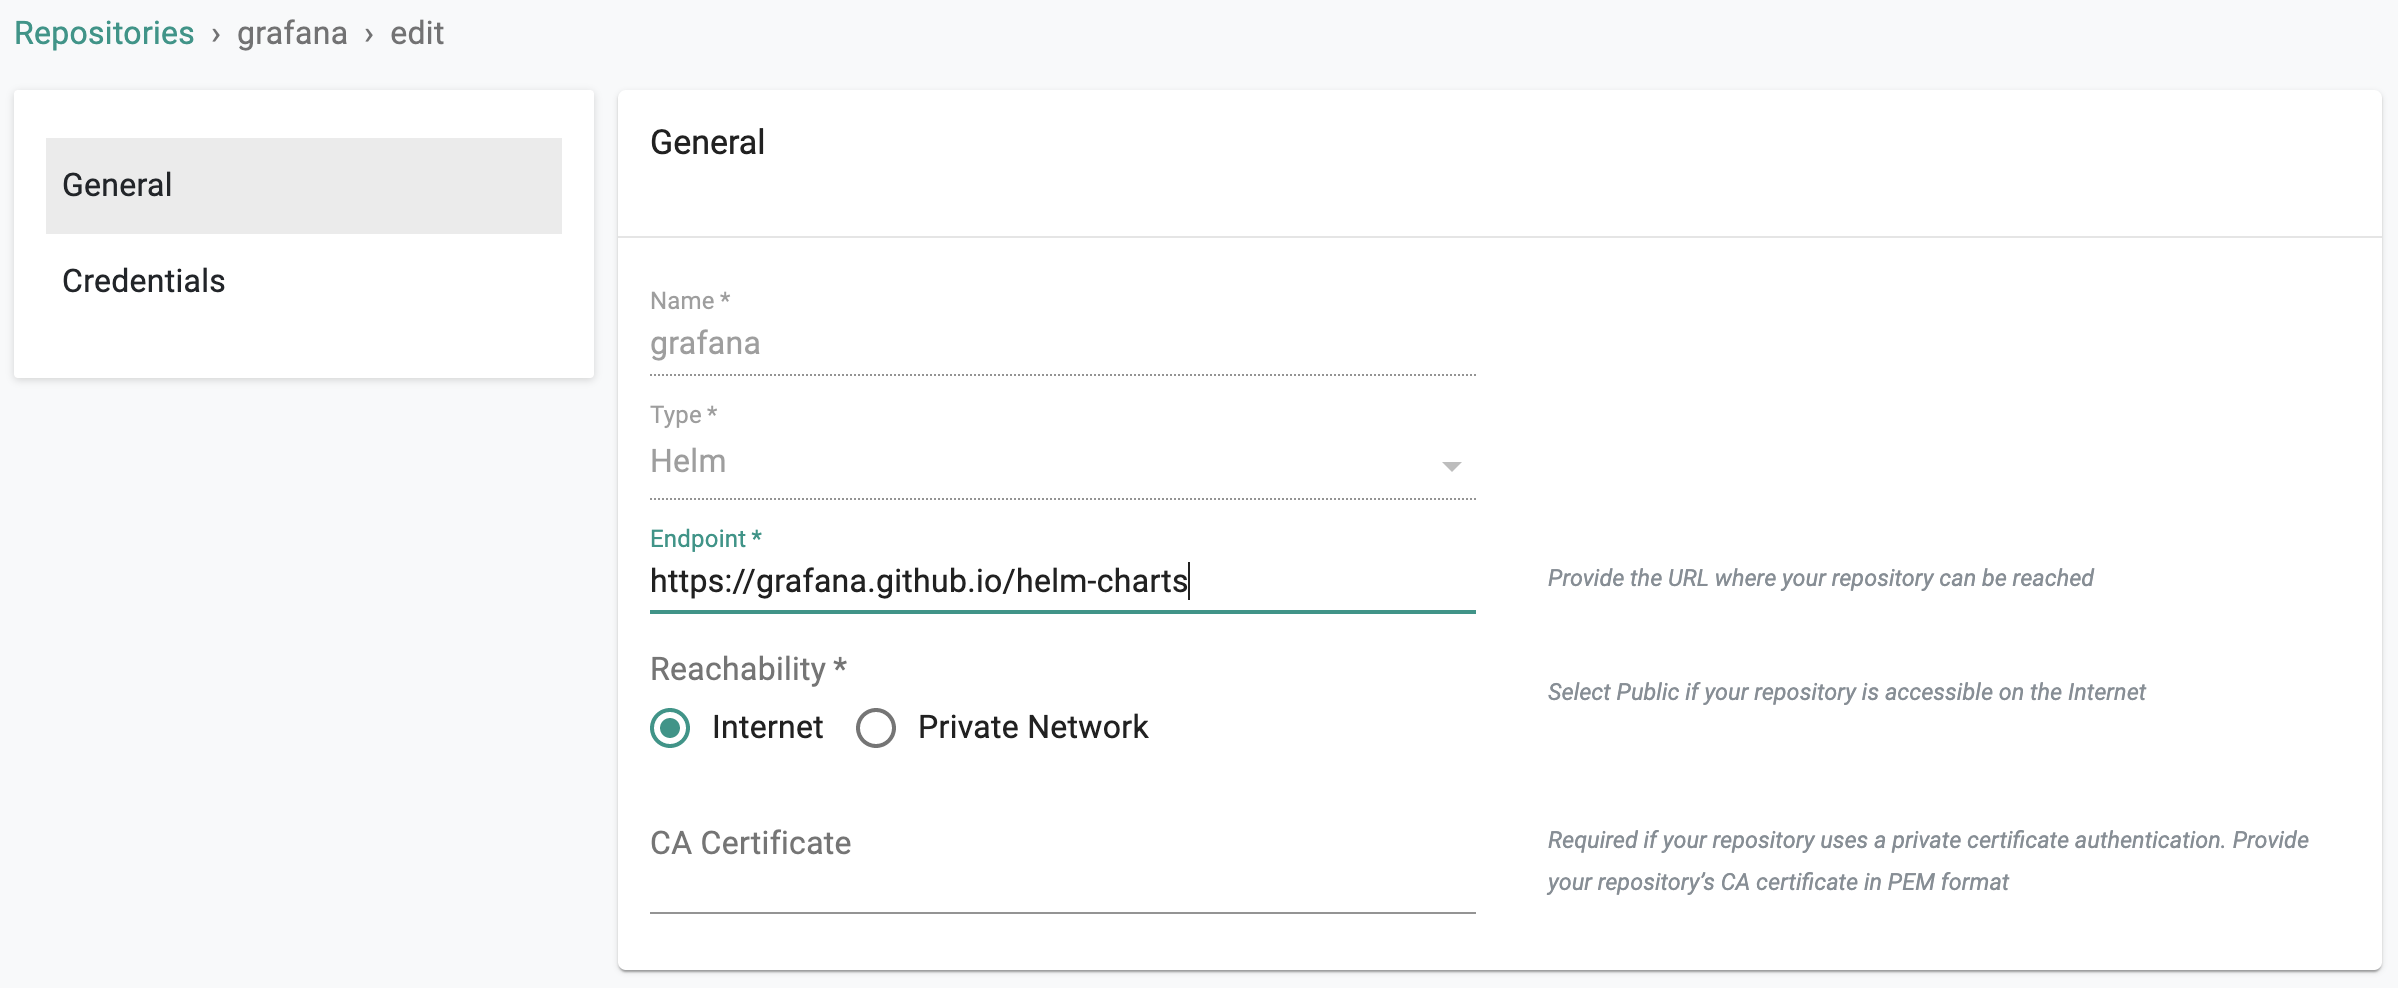
Configure the Grafana repo endpoint so that the controller can automatically retrieve the required Helm chart directly from the official Internet facing repository.
- Click on Integrations -> Repository.
- Create New Repository -> Provide a name such as "grafana" and Select "Helm" for Type.
- Enter "https://grafana.github.io/helm-charts" for endpoint and Select "Internet Facing" for reachability.
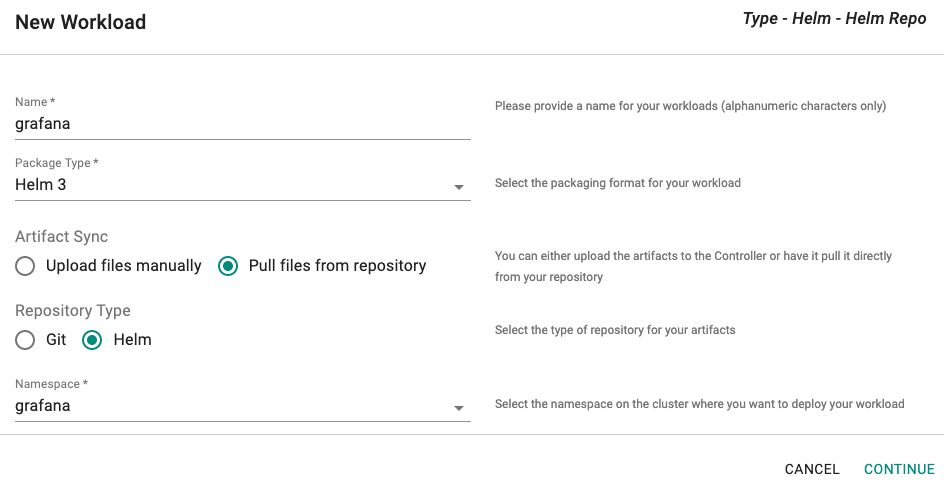
Create Workload
- Click on Application -> Workloads.
- Click on Create New Workload with the name "grafana".
- Select "Helm3" for addon type.
- Select "Pull files from repository" for Artifact Sync.
- Select the "grafana" namespace from the dropdown.
For repository configuration, - Select the "grafana" repository from the dropdown. - Enter "grafana" for chart name.
Custom Values
We need to customize the Grafana Workload with an override "values file" comprising the following:
- The IRSA for Grafana to perform remote queries to the AMP workspace
- The AMP query endpoint URL details (from AWS Console)
- The AWS region for the AMP workspace
- EKS cluster name
Note
From the AMP query endpoint URL, remove the /api/v1/query string that is appended to the URL, because the Prometheus data source will automatically append it.
- Save the YAML provided below to a file and update the fields appropriately.
- Add the values.yaml file to the workload's override YAML.
serviceAccount:
  create: false
  name: <IRSA for Grafana>
grafana.ini:
  auth:
    sigv4_auth_enabled: true
service:
  type: LoadBalancer
adminPassword: "Admin Password for Grafana"
datasources:
 datasources.yaml:
   apiVersion: 1
   datasources:
   - name: <Name of EKS Cluster>
     type: prometheus
     url: <URL for Query Endpoint for AMP Workspace>
     access: proxy
     jsonData:
       sigV4Auth: true
       sigV4AuthType: default
       sigV4Region: <AWS Region for AMP Workspace>
     isDefault: true

dashboardProviders:
  dashboardproviders.yaml:
    apiVersion: 1
    providers:
    - name: 'default'
      orgId: 1
      folder: ''
      type: file
      disableDeletion: false
      editable: true
      options:
        path: /var/lib/grafana/dashboards/default

dashboards:
  default:
    k8sClusterDashboard:
      gnetId: 7249
      datasource: <Name of EKS Cluster>
    k8sClusterResource:
      gnetId: 12114
      datasource: <Name of EKS Cluster>
    k8sNamespaceResource:
      gnetId: 12117
      datasource: <Name of EKS Cluster>
    k8sPodResource:
      gnetId: 12120
      datasource: <Name of EKS Cluster>
    k8sNodeResource:
      gnetId: 12119
      datasource: <Name of EKS Cluster>
    k8sNodeExporter:
      gnetId: 11074
      datasource: <Name of EKS Cluster>
    k8sDeployStsDs:
      gnetId: 8588
      datasource: <Name of EKS Cluster>
    k8sAppMetrics:
      gnetId: 1471
      datasource: <Name of EKS Cluster>
    k8sNetworkingCluster:
      gnetId: 12124
      datasource: <Name of EKS Cluster>
    k8sNetworkingNamespace:
      gnetId: 12125
      datasource: <Name of EKS Cluster>
    k8sNetworkingPod:
      gnetId: 12661
      datasource: <Name of EKS Cluster>
Publish Workload
- Select the EKS Cluser for Placement
- Publish the grafana workload
In a few seconds, the Load Balancer should be available and you can retrieve the public URL using kubectl
kubectl get services
NAME      TYPE           CLUSTER-IP       EXTERNAL-IP                                                               PORT(S)        AGE
grafana   LoadBalancer   10.100.155.117   a23f54aa0bd2c40d9920.us-west-1.elb.amazonaws.com   80:31274/TCP   5m12s
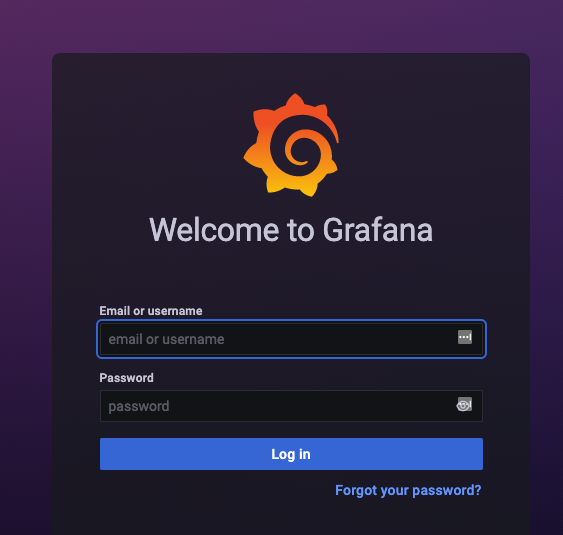
Step 3: Access Grafana
- Navigate to the Load Balancer's public URL to access Grafana.
- Use "admin" for the username and the admin password you set in your custom values.yaml file to view the Grafana dashboards.
- Navigate to Dashboards and select any dashboard to view the data.
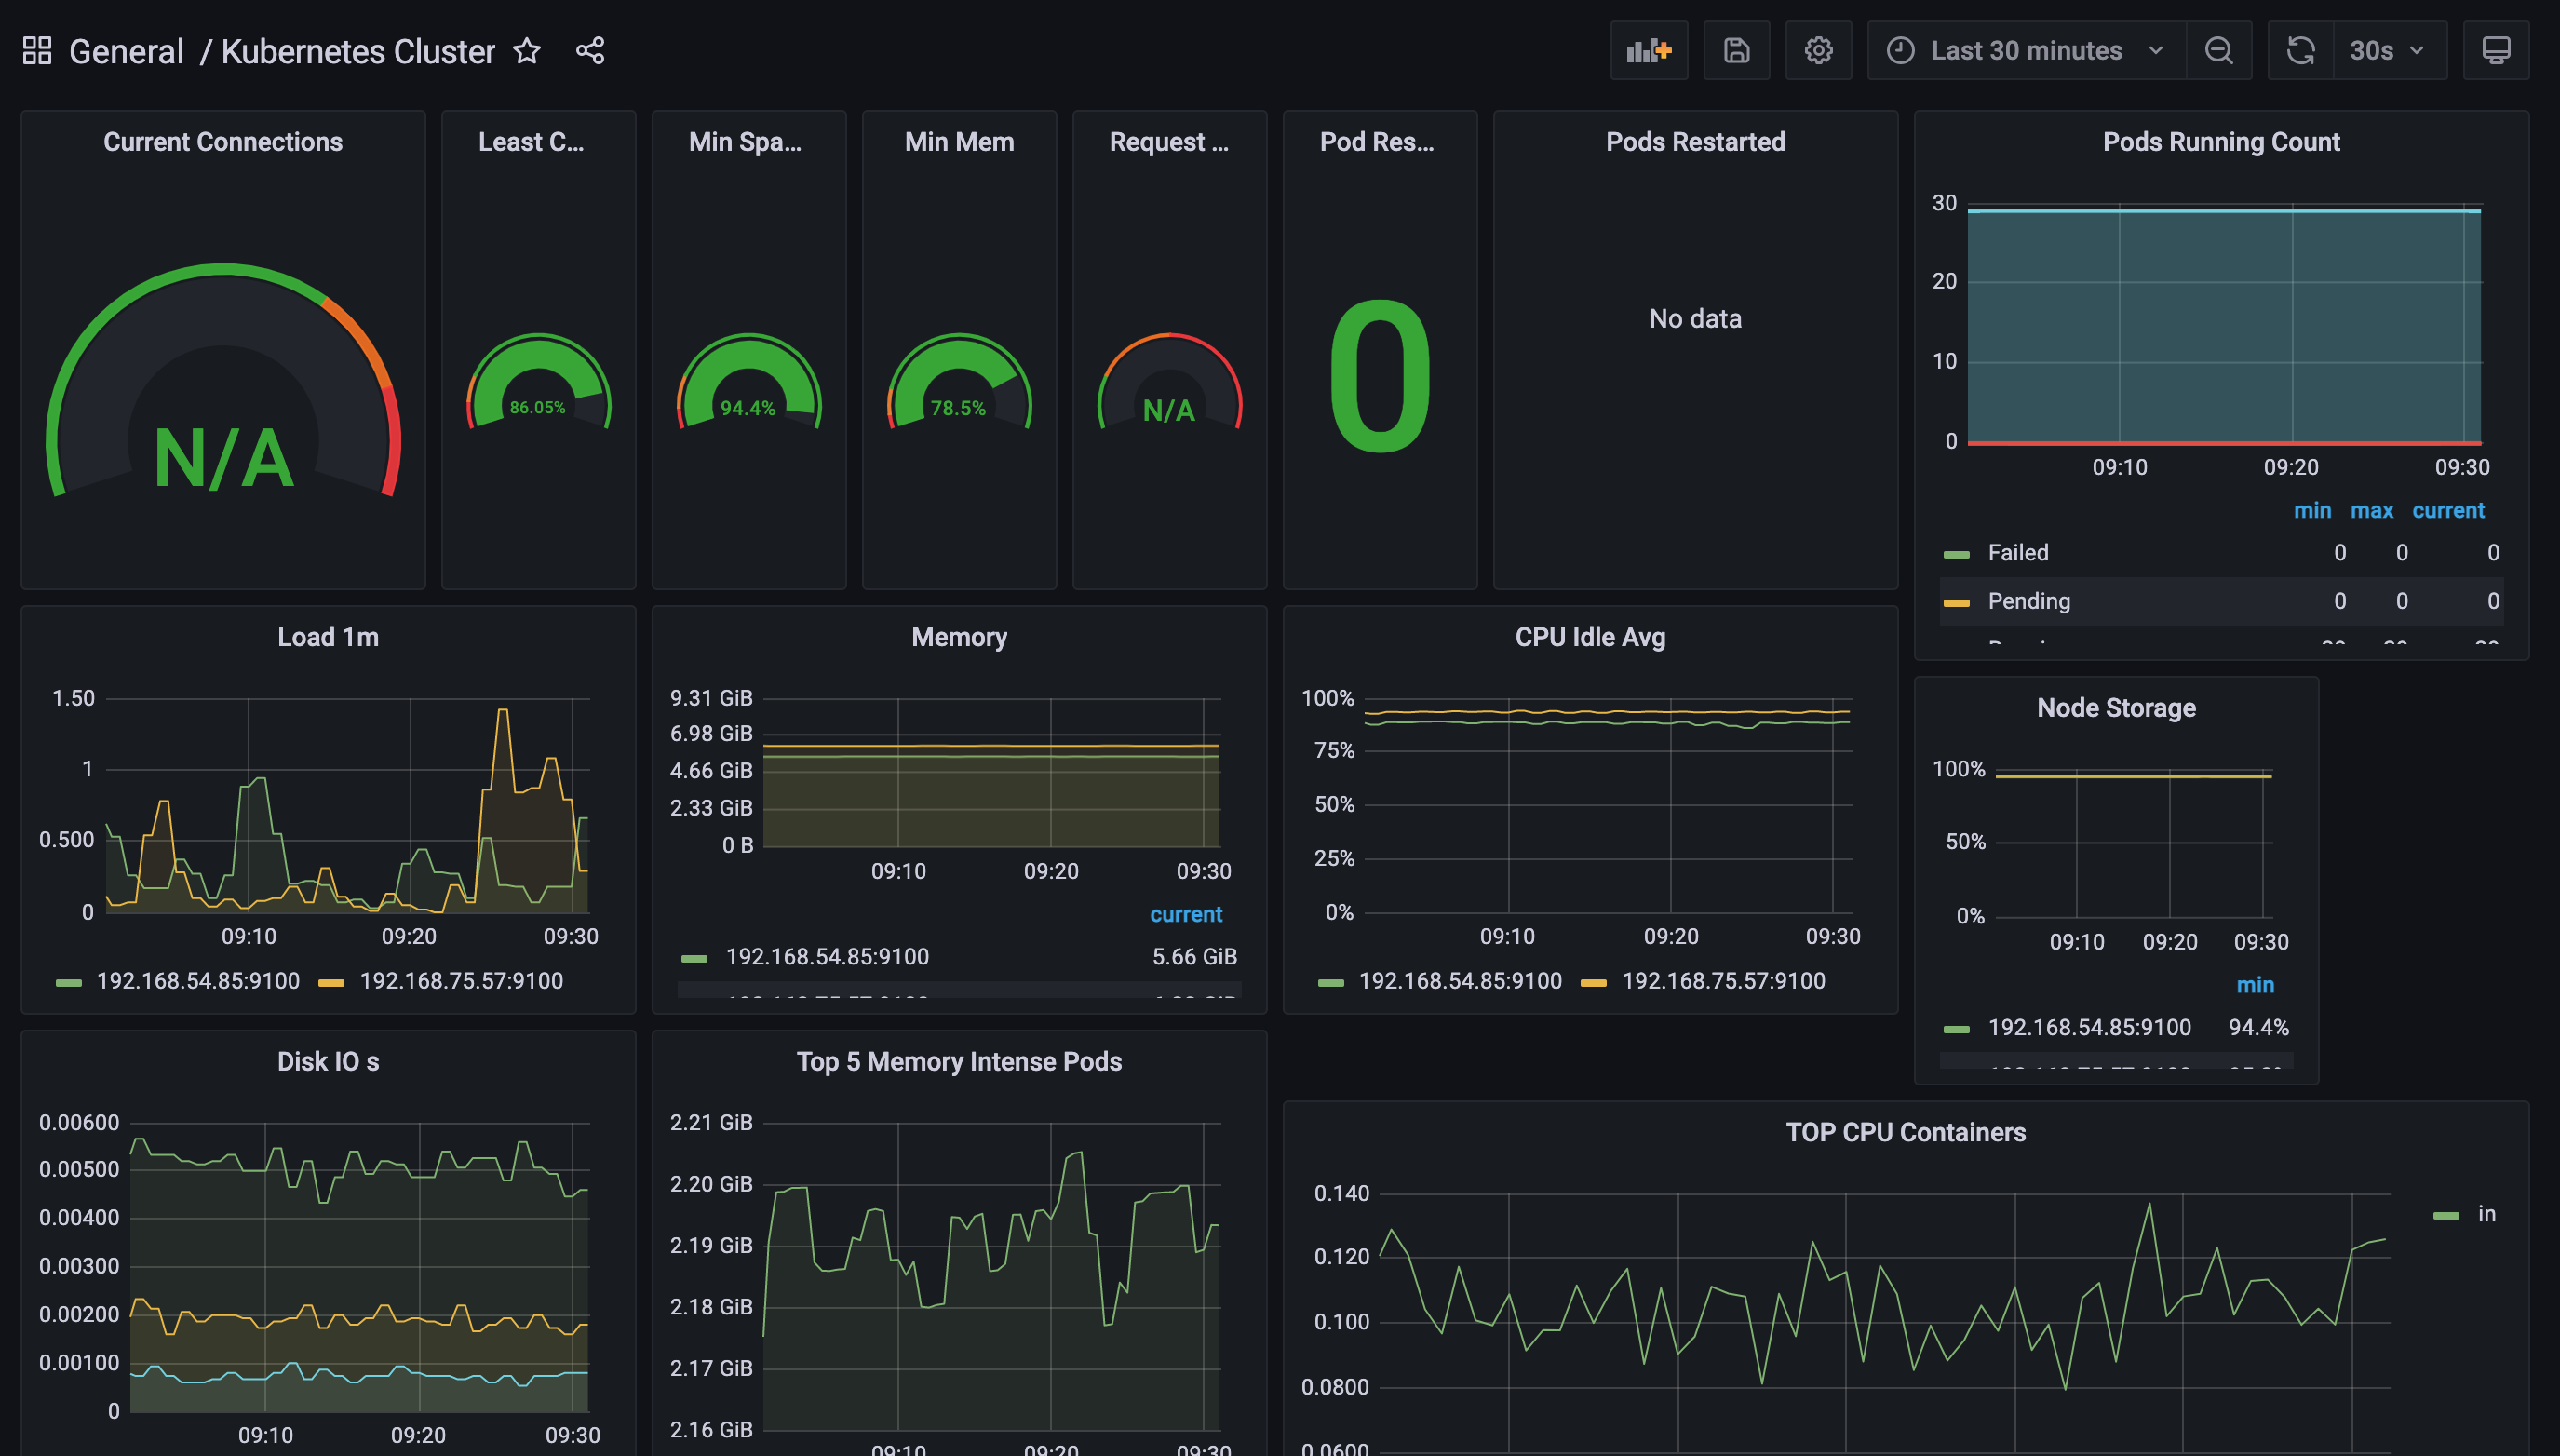
Congratulations! You can now use Grafana to view the metrics aggregated in your AMP workspace.