Part 1: Provision
In this exercise, you will focus on provisioning an upstream MKS cluster using the web console or the RCTL CLI.
What Will You Do
In this part, you will:
- Create a new Project in your Org
- Provision an MKS cluster
- Verify cluster health
- Review available dashboards
Step 1: Create Project
In this step, we will create a new project which will serve as a logically isolated "operating environment" (sub tenant).
Note
Creating a project requires "Org Admin" privileges.
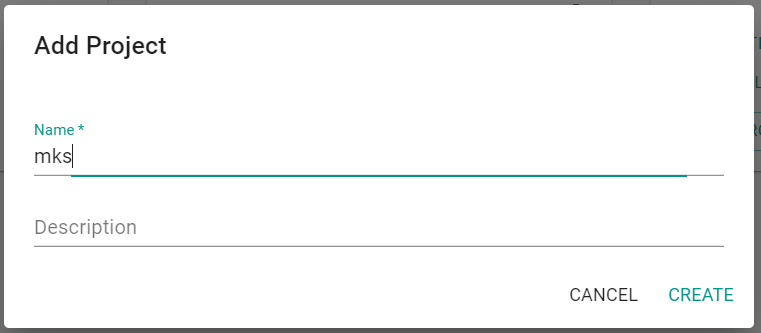
- Create a new project called "mks"
- Switch context to this project by clicking on the project in the web console
Step 3: Configure & Provision Cluster
In this step, you will configure and customize your Cluster using either the web console or the RCTL CLI with a YAML based cluster specification.
- Navigate to the previously created project in your Org
- Select Infrastructure -> Clusters
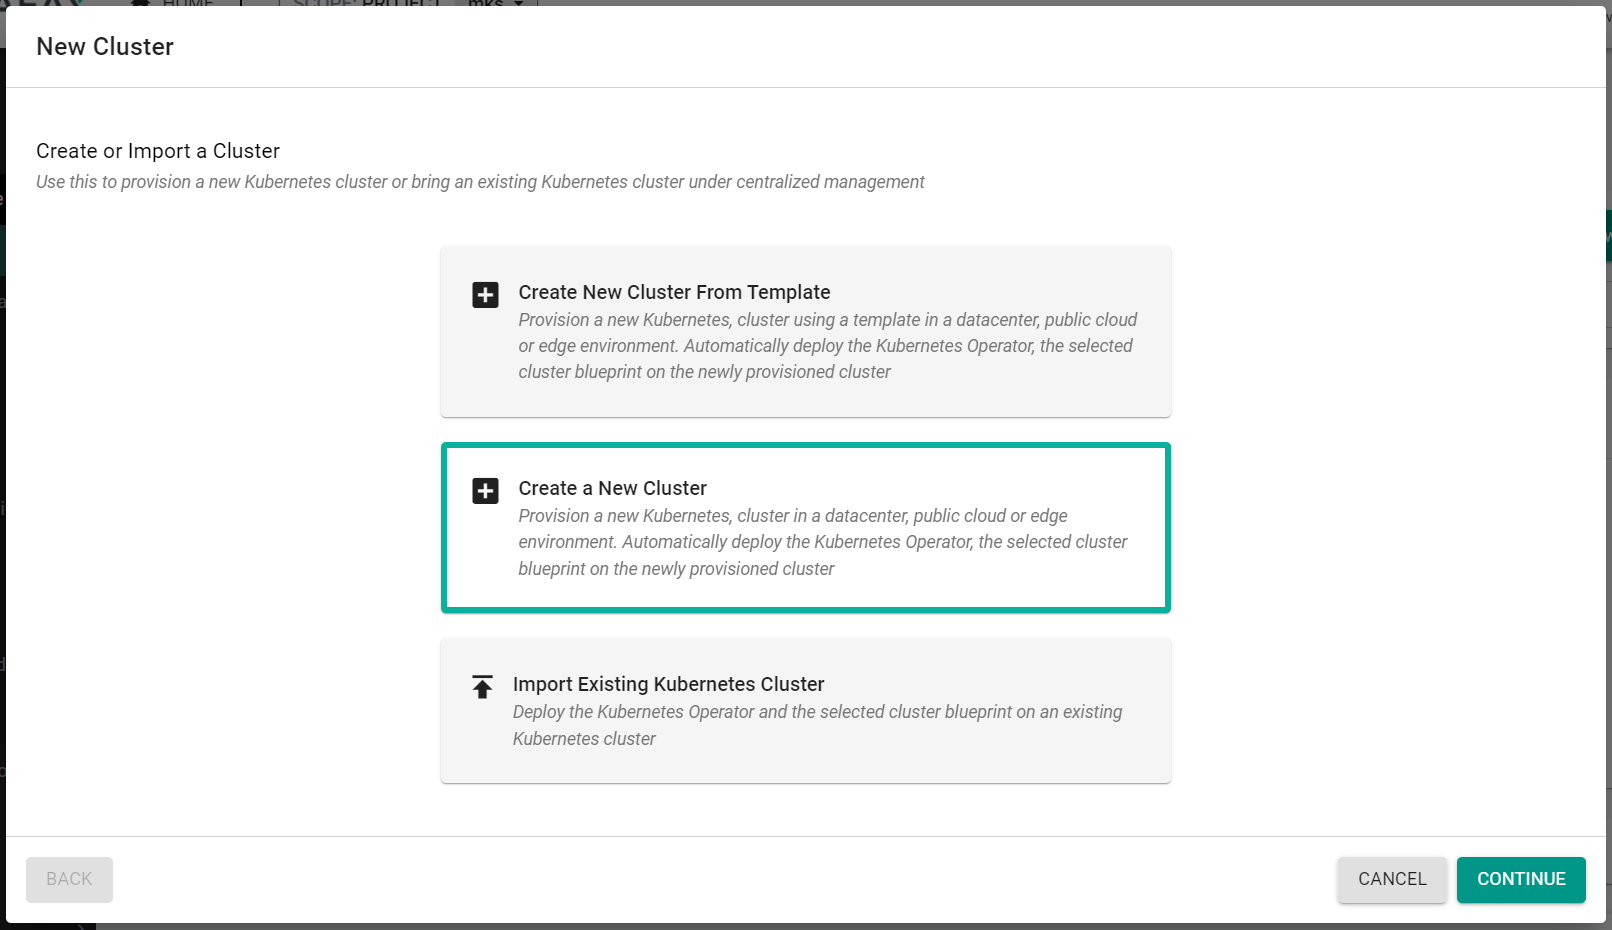
- Click "New Cluster"
- Select "Create a New Cluster"
- Click "Continue"
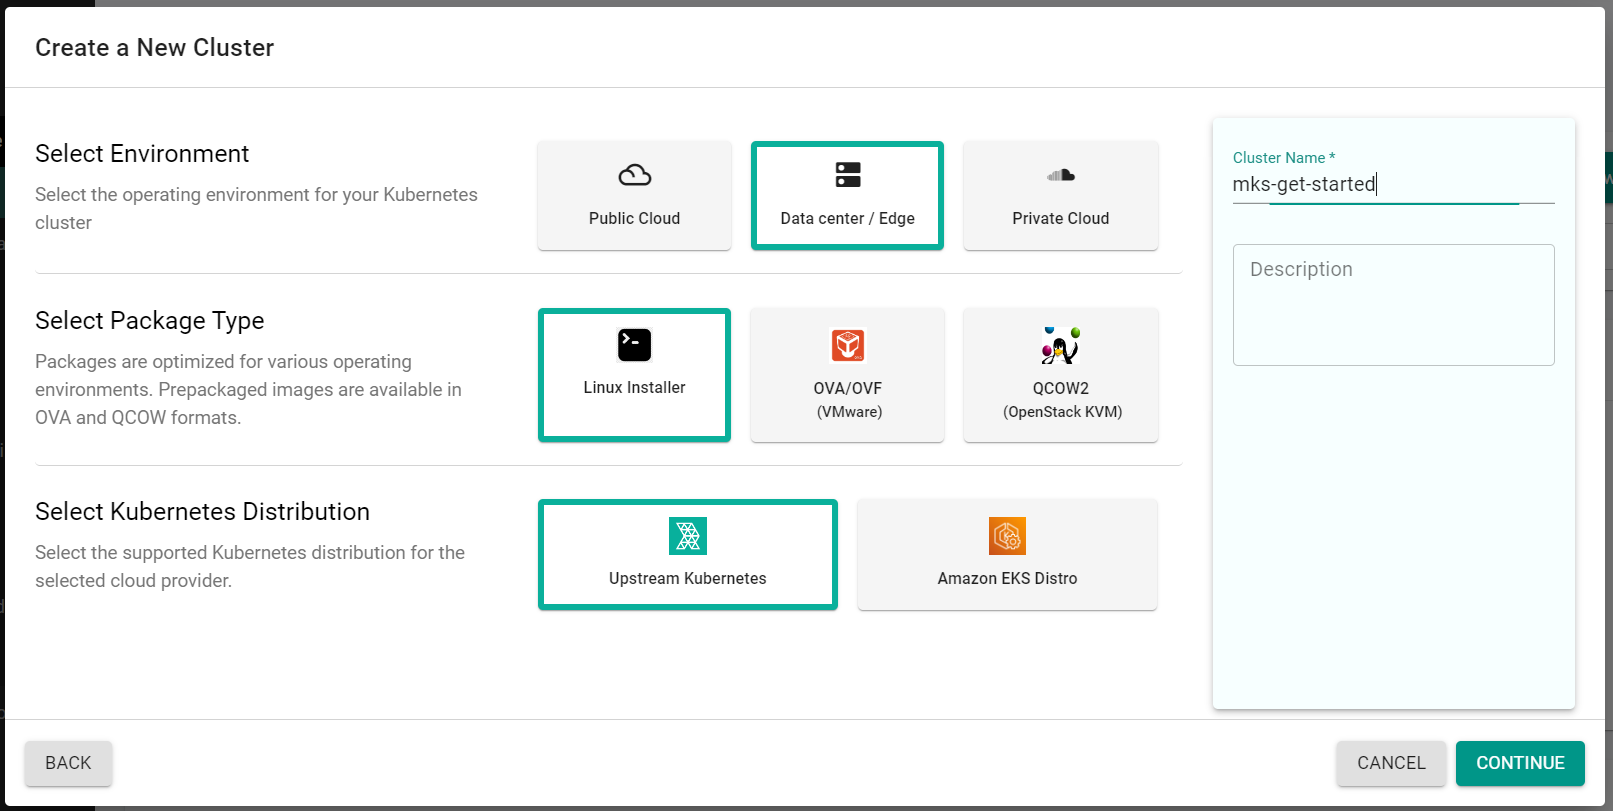
- Select "Data center / Edge"
- Select "Linux Installer"
- Select "Upstream Kubernetes"
- Enter a cluster name
- Click "Continue"
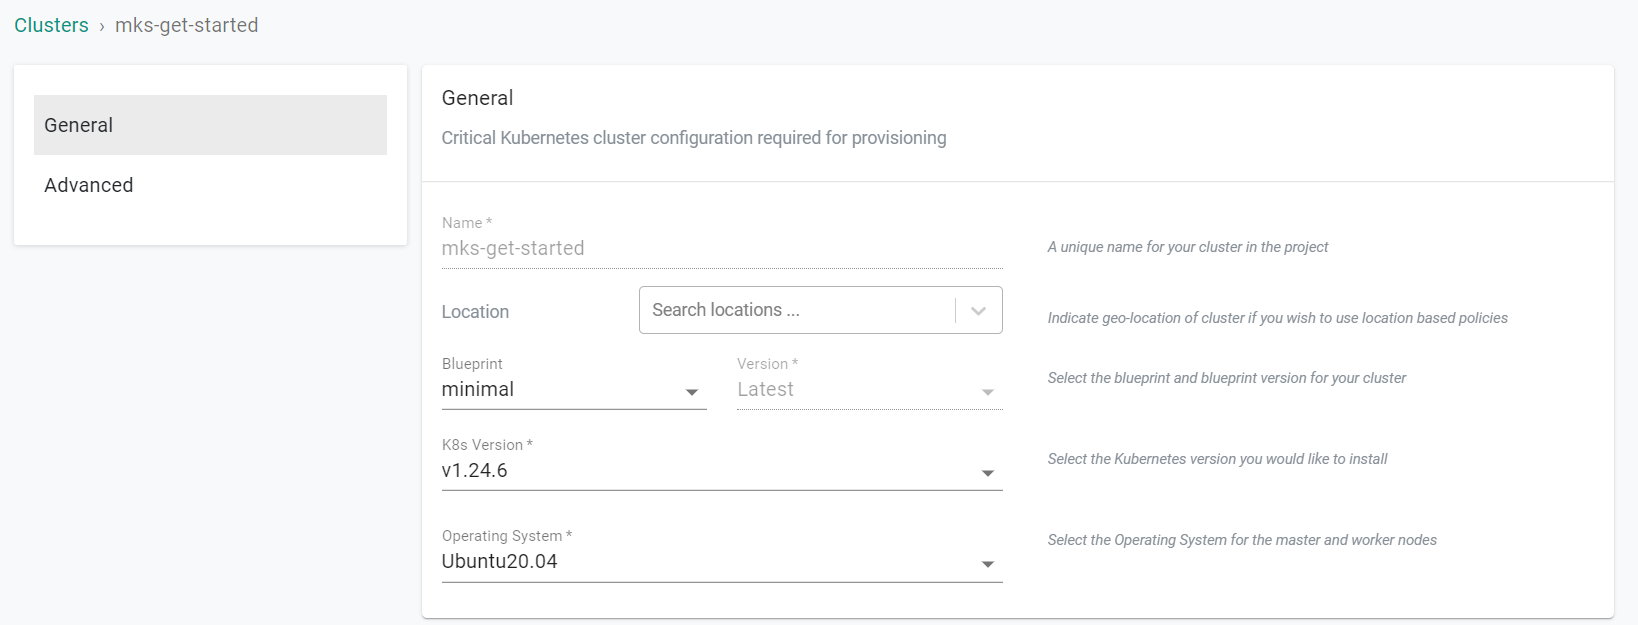
- Select the "minimal" blueprint
- Select the "K8s Version"
- Select an "Operating System"
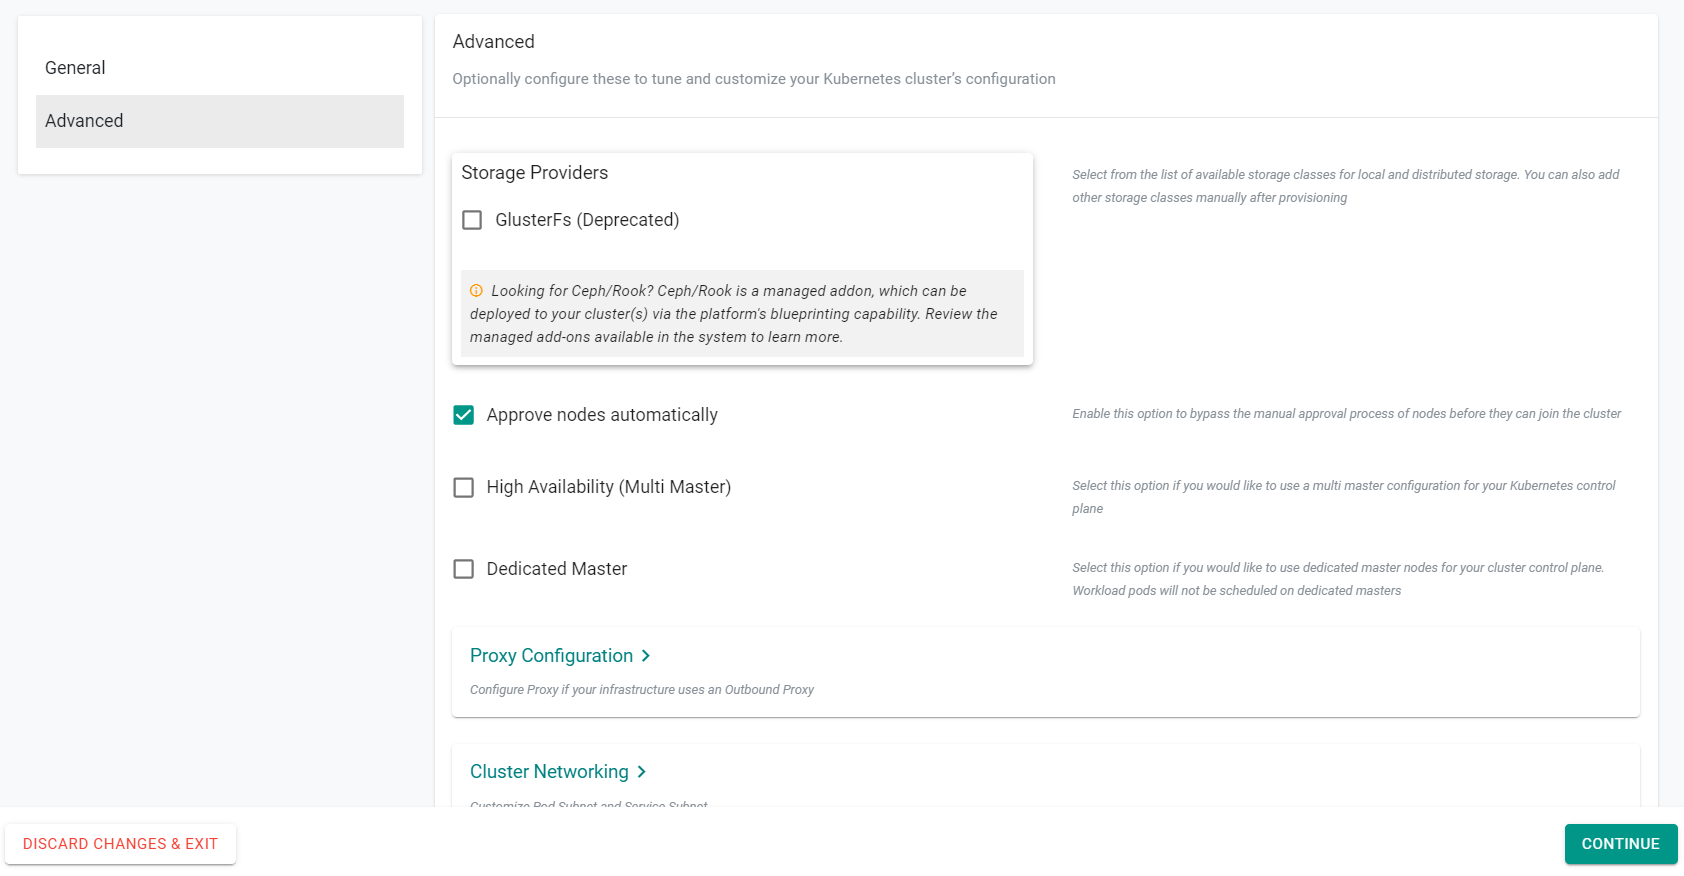
- Under the "Advanced" section, deselect "GlusterFs"
- Select "Approve nodes automatically"
- Click "Continue"
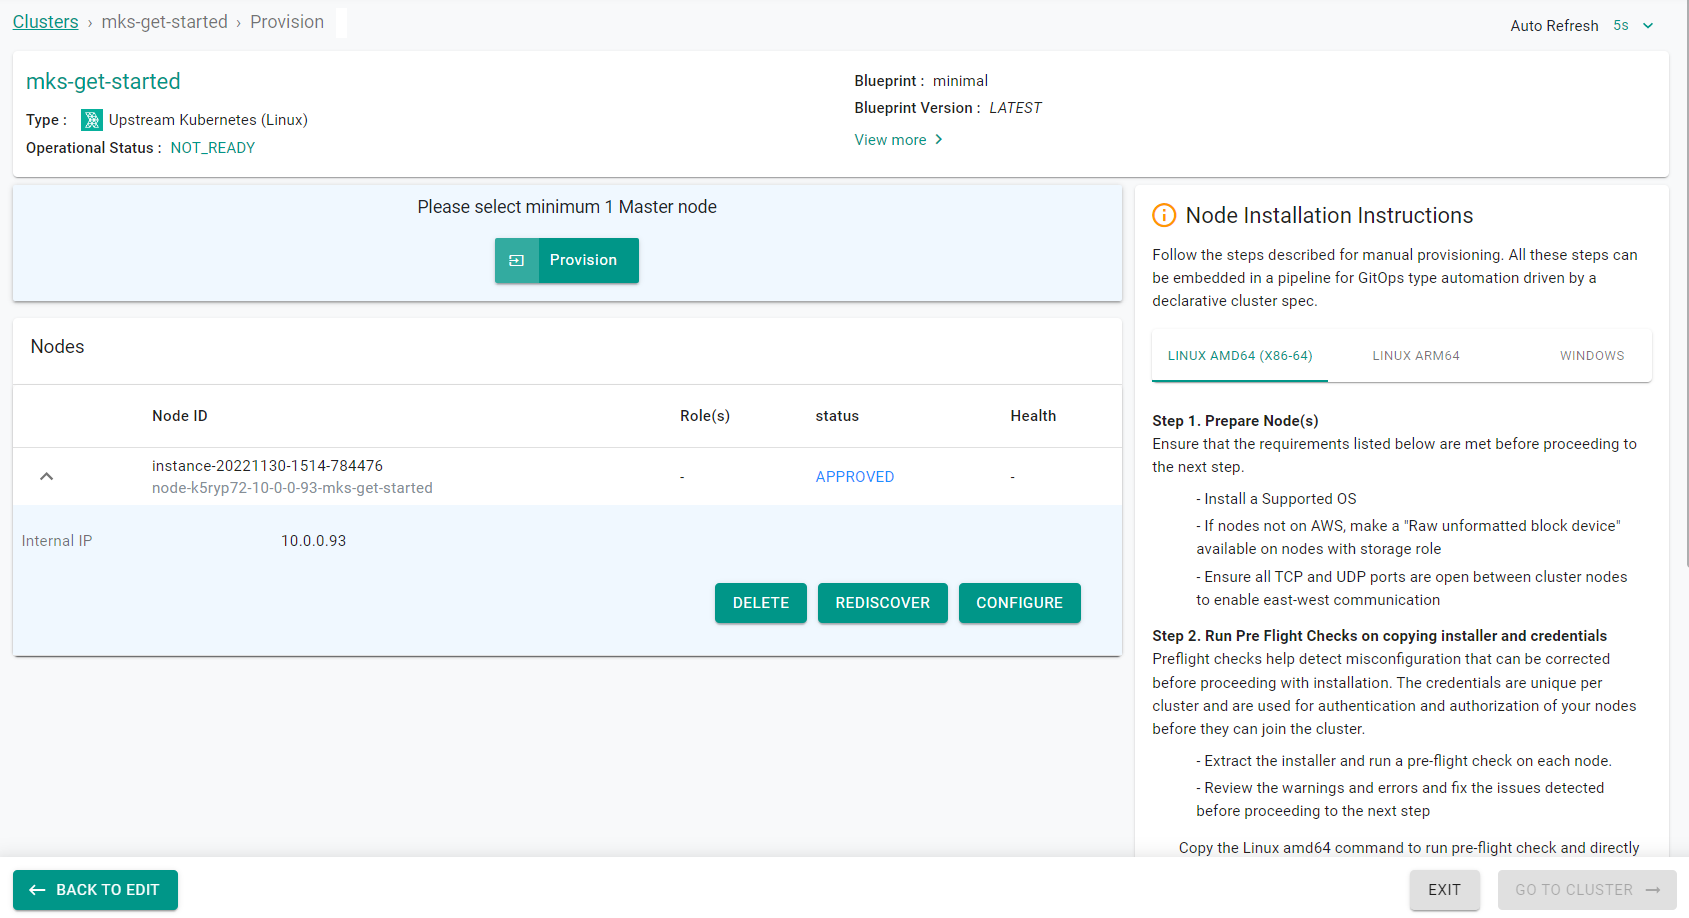
- Follow the "Node Installation Instructions" on the right side of the console screen. These instructions will require you to have a shell into the node. You will need to copy the commands in the installation instructions and execute them on the node. The node will then be configured and presented in the provisioning window.
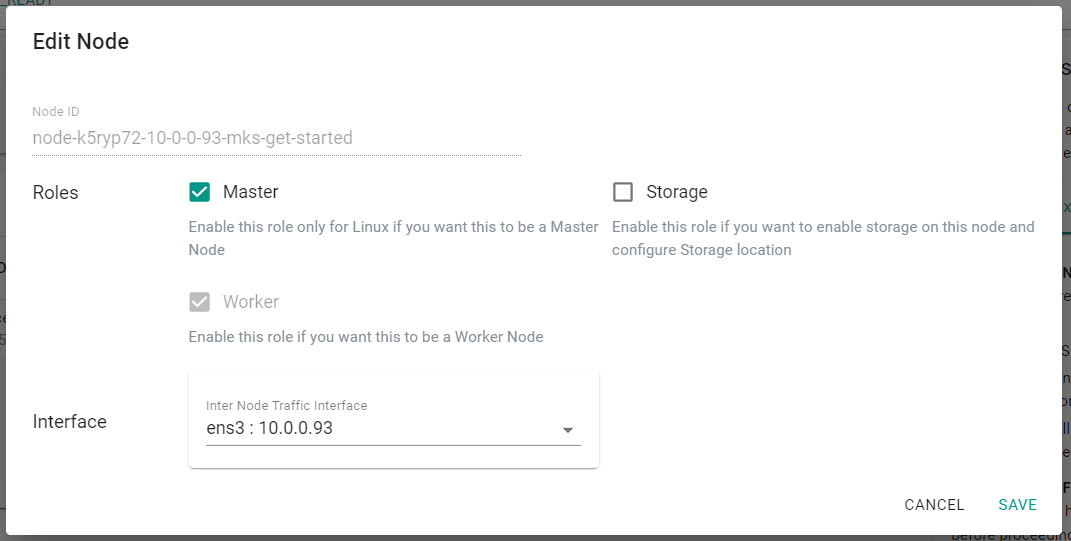
- Once the node has been discovered and automatically approved, click "Configure"
- Select "Master" for the node role
- Click "Save"
- Click "Provision"
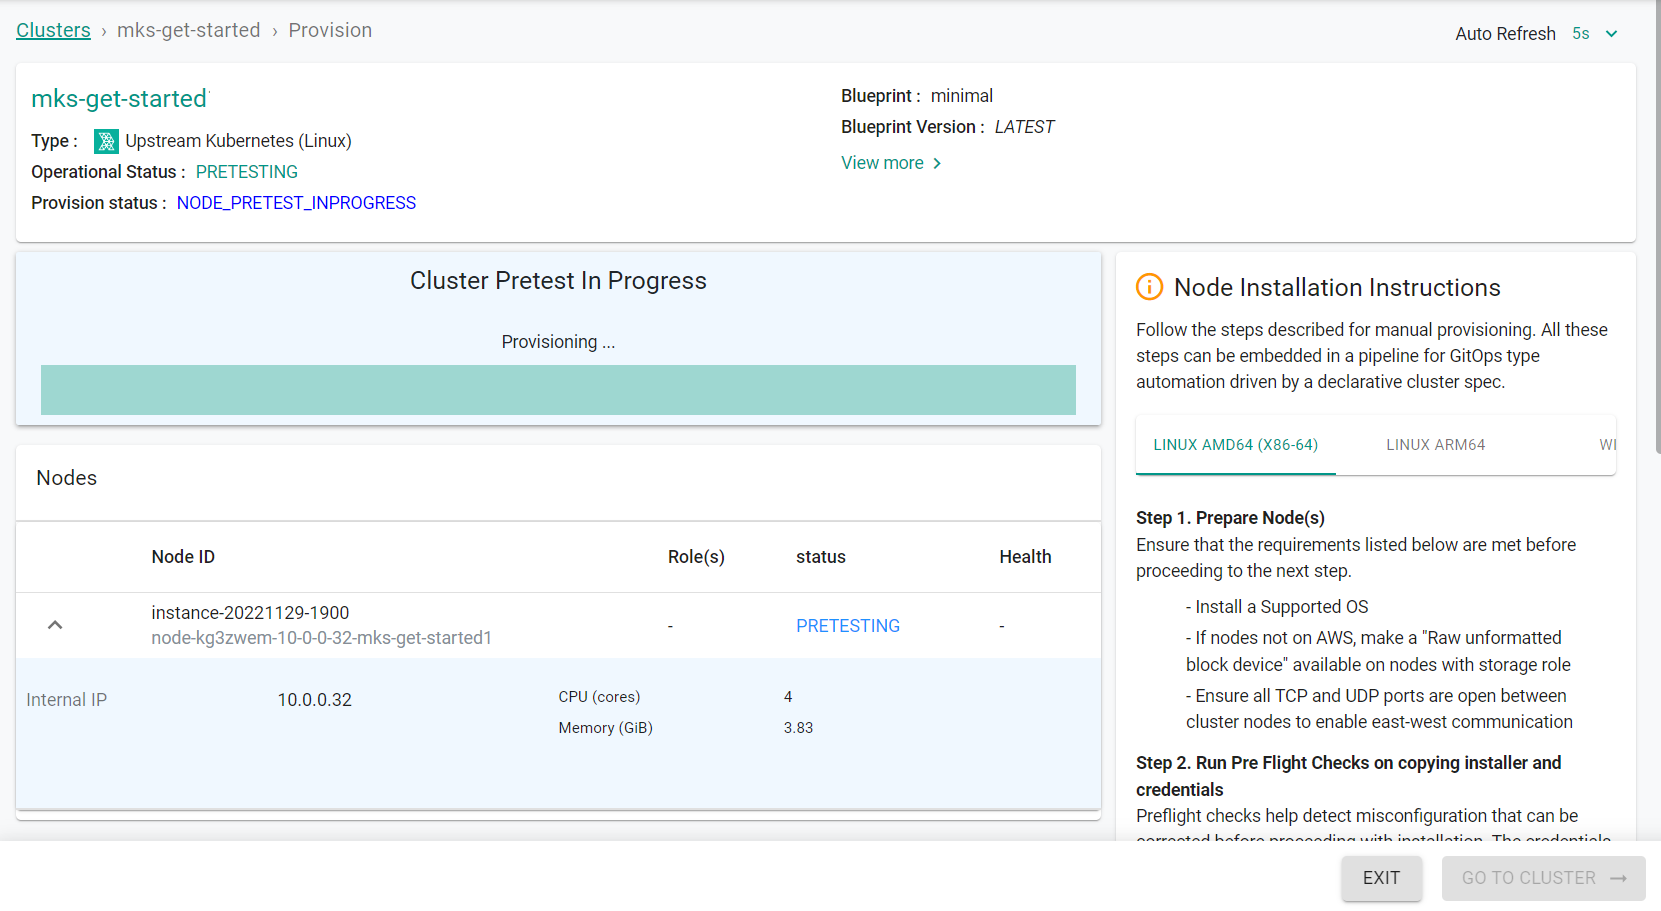
Provisioning will take approximately 15 minutes to complete. The final step in the process is the blueprint sync for the default blueprint. This can take a few minutes to complete because this requires the download of several container images and deployment of monitoring and log aggregation components.
- Save the below specification file to your computer as "mks-cluster-basic.yaml". Note, the highlighted sections in the spec will need to be updated to match your environment.
apiVersion: infra.k8smgmt.io/v3
kind: Cluster
metadata:
  name: mks-get-started
  project: mks
  labels:
    check1: value1
    check2: value2
spec:
  blueprint:
    name: default
    version: 1.20.0
  config:
    autoApproveNodes: true
    dedicatedMastersEnabled: false
    highAvailability: false
    kubernetesVersion: v1.24.6
    location: sanjose-us
    network:
      cni:
        name: Calico
        version: 3.19.1
      podSubnet: 10.244.0.0/16
      serviceSubnet: 10.96.0.0/12
    nodes:
    - arch: amd64
      hostname: instance-20221129-1019
      operatingSystem: Ubuntu20.04
      privateip: 172.31.61.40
      roles:
      - Master
      - Worker
      - Storage
      ssh:
        ipAddress: 129.146.170.111
        port: "22"
        privateKeyPath: mks-get-started1.pem
        username: ubuntu
  type: mks
Update the following sections of the specification file with details to match your environment
-
Update the name section with the name of the cluster and the project with the name of the project
name: mks-get-started project: mks -
Update the hostname section with the hostname of the node being used and the operatingsystem section with the operating system of the node
hostname: instance-20221129-1019 operatingSystem: Ubuntu20.04 -
Update the SSH section settings with the SSH details of the node.
  ipAddress: 129.146.170.111
  port: "22"
  privateKeyPath: mks-get-started1.pem
  username: ubuntu
Note, the PEM file should be located in the same directory as the cluster YAML
- Save the updates that were made to the file
- Execute the following command to provision the cluster from the specification file previously saved
./rctl apply -f mks-cluster-basic.yaml
You will see output similar to the following
{
  "taskset_id": "gkjr80m",
  "operations": [
    {
      "operation": "ClusterCreation",
      "resource_name": "mks-get-started",
      "status": "PROVISION_TASK_STATUS_PENDING"
    },
    {
      "operation": "BlueprintSync",
      "resource_name": "mks-get-started",
      "status": "PROVISION_TASK_STATUS_INPROGRESS"
    }
  ],
  "comments": "The status of the operations can be fetched using taskset_id",
  "status": "PROVISION_TASKSET_STATUS_PENDING"
}

Downloading Installer And Credentials
Copying Installer and credentials to node:  129.146.141.203
Running the Pre-Flight checks on node:  129.146.141.203
Running Installer command on node:  129.146.141.203
[+] Performing pre-tests
  [+] Operating System check
  [+] CPU check
  [+] Memory check
  [+] Internet connectivity check
  [+] Connectivity check to rafay registry
  [+] DNS Lookup to the controller
  [+] Connectivity check to the Controller
  [+] Multiple default routes check
  [+] Time Sync check
  [+] Storage check
      Detected device: /dev/loop0, mountpoint: /snap/core18/2566, type: loop, size: 55.6M, fstype: squashfs
      Detected device: /dev/loop1, mountpoint: /snap/lxd/22753, type: loop, size: 67.8M, fstype: squashfs
      Detected device: /dev/loop2, mountpoint: /snap/snapd/17336, type: loop, size: 48M, fstype: squashfs
      Detected device: /dev/loop3, mountpoint: /snap/core20/1623, type: loop, size: 63.2M, fstype: squashfs
      Detected device: /dev/loop4, mountpoint: /snap/oracle-cloud-agent/44, type: loop, size: 59.6M, fstype: squashfs
      Detected device: /dev/sda, mountpoint: null, type: disk, size: 46.6G, fstype: null
      Detected device: /dev/sda1, mountpoint: /, type: part, size: 46.5G, fstype: ext4
      Detected device: /dev/sda14, mountpoint: null, type: part, size: 4M, fstype: null
      Detected device: /dev/sda15, mountpoint: /boot/efi, type: part, size: 106M, fstype: vfat
  [+] Hostname underscore check
  [+] DNS port check
  [+] Nameserver Rotate option check for /etc/resolv.conf

[+] Checking for Warnings

[+] Checking for Fatal errors

[+] Checking for hard failures
  No Fatal Errors... Continuing

[+] Initiating cluster node install
  [+]  Detected Operating System Ubuntu-20.04
  [+]  Detected System architecture amd64
  [+]  Enabling multi minion support
  [+]  Updating system package repository database
  [+]  Installing node-agent
  [+]  Setting node ID to node-2q9e4nm-10-0-0-61-mks-get-started
  [+]  Installing credentials on node
  [+]  Configuring node-agent
  [+]  Installing and starting node-proxy
  [+]  Starting node-agent
  [+]  Setting up the crontab
  [+]  Successfully performed all operations
- Login to the web console and click on the cluster name to view the cluster being provisioned
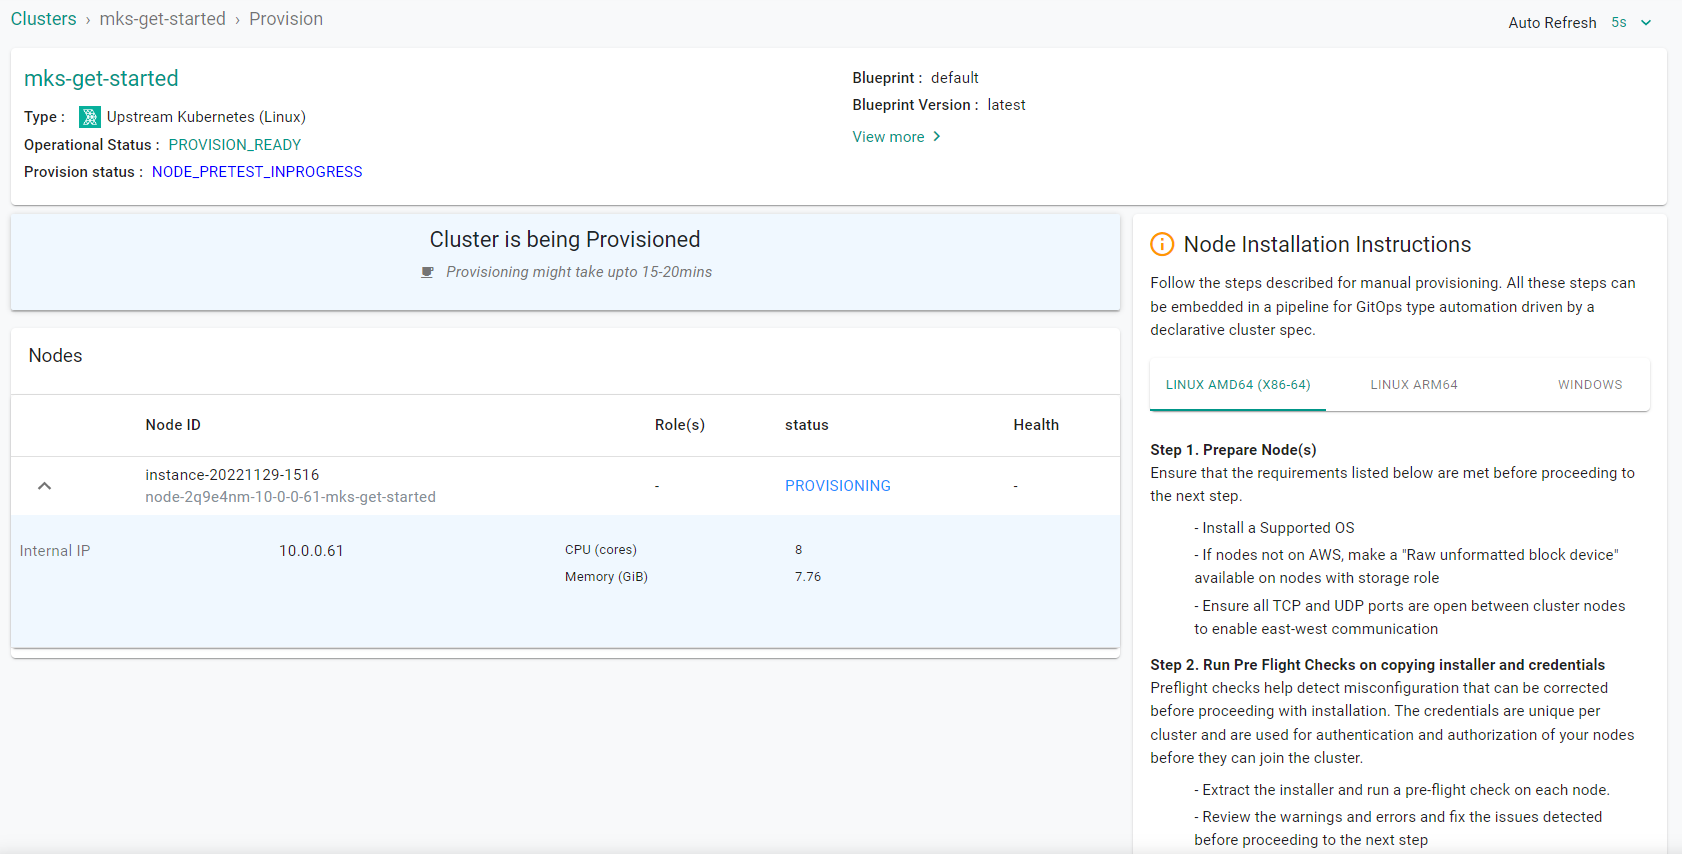
Provisioning the infrastructure will take approximately 15 minutes to complete. The final step in the process is the blueprint sync for the default blueprint's add-ons. This can take a few minutes to complete because this requires the download and deployment of several container images associated add-ons.
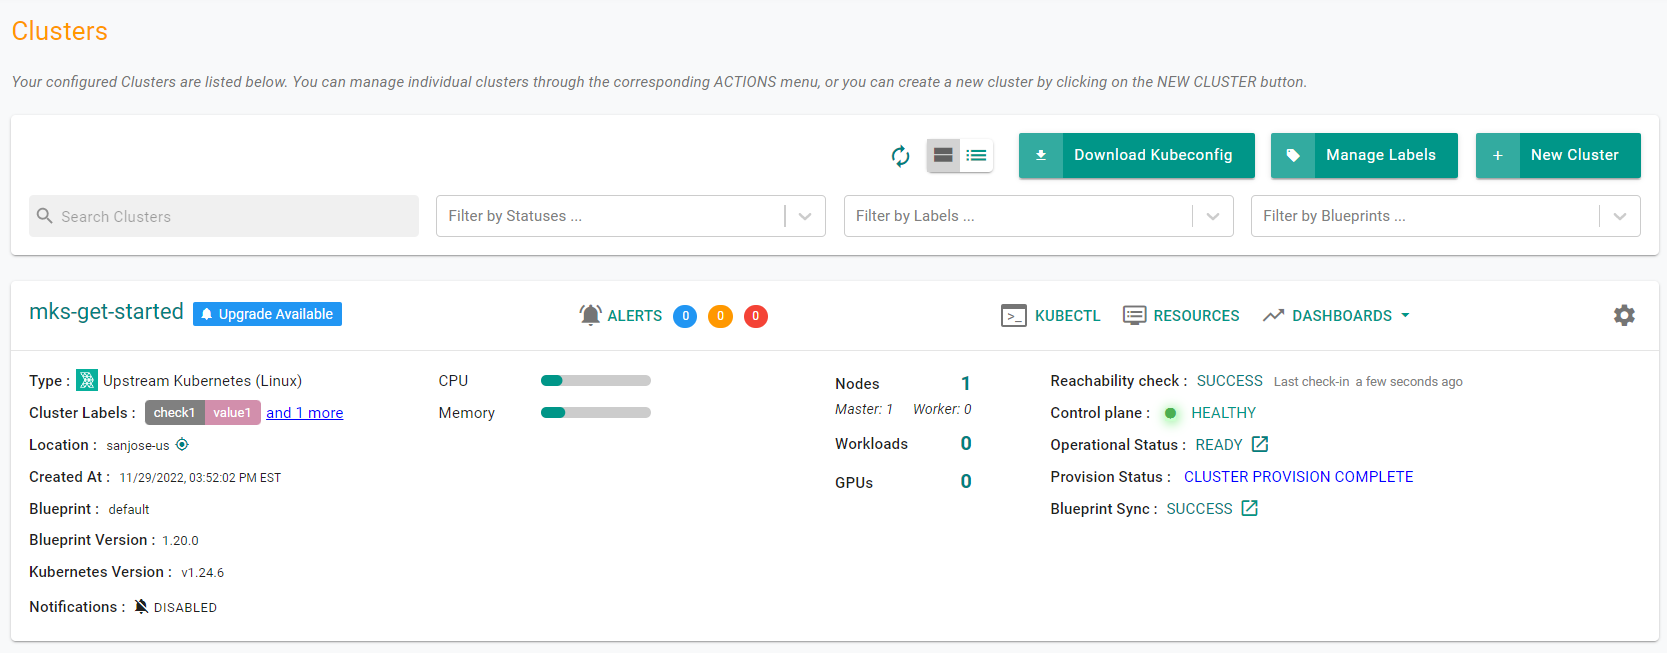
Once the cluster finishes provisioning, download the cluster configuration file and compare it to the specification file used to create the cluster. The two files will match.
- Go to Clusters -> Infrastructure.
- Click on the Settings Icon for the newly created cluster and select "Download Cluster Config"
Step 4: Verify Cluster
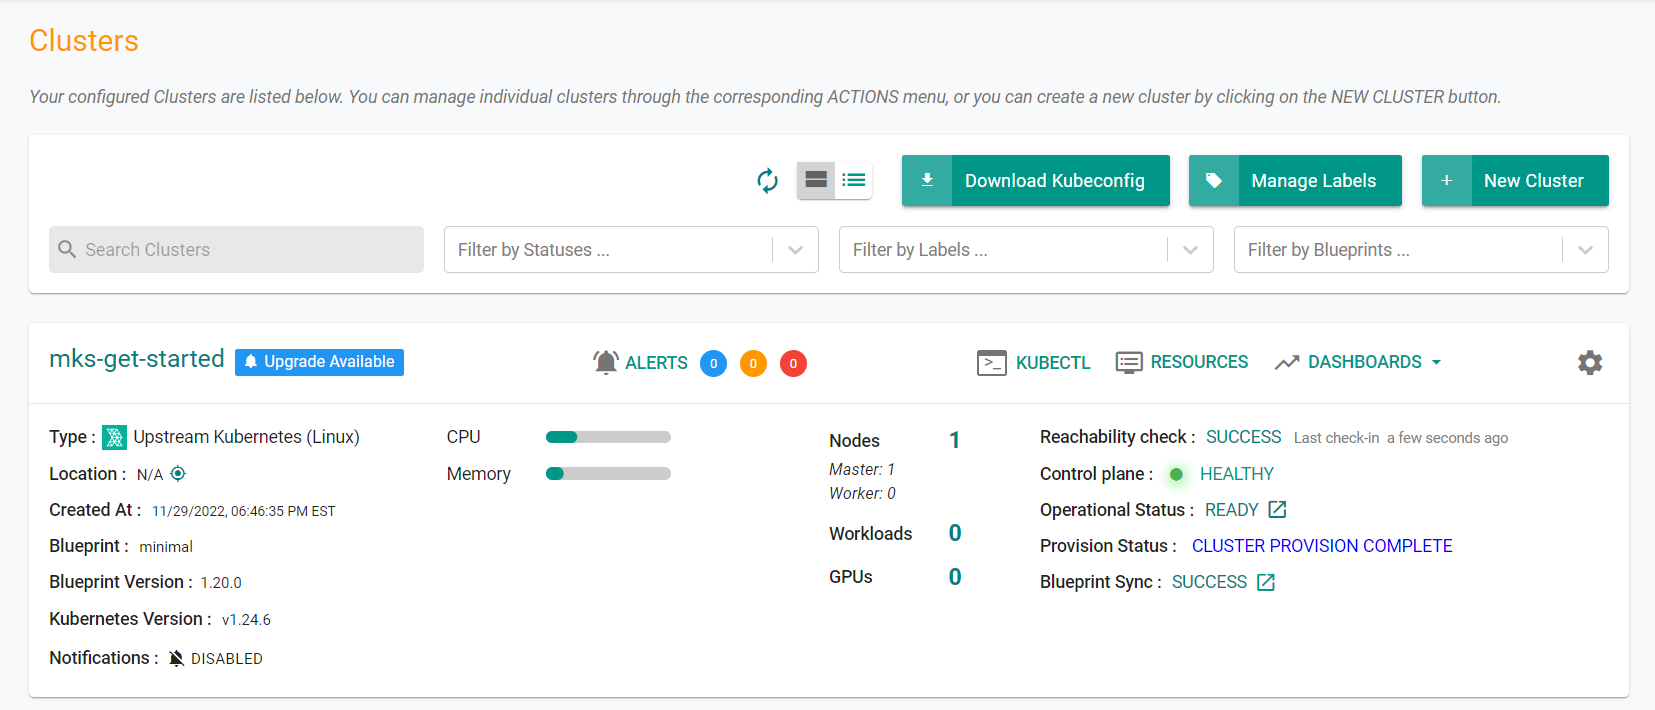
Once provisioning is complete, you should have a ready to use Cluster. We will verify the cluster by checking its health and status.
Step 4a: Cluster Status & Health
The Kubernetes management operator automatically deployed on the cluster by the controller will "maintain a heartbeat" with the controller and will "proactively monitor" the status of the components on the worker node required for communication with the control plane and the controller.
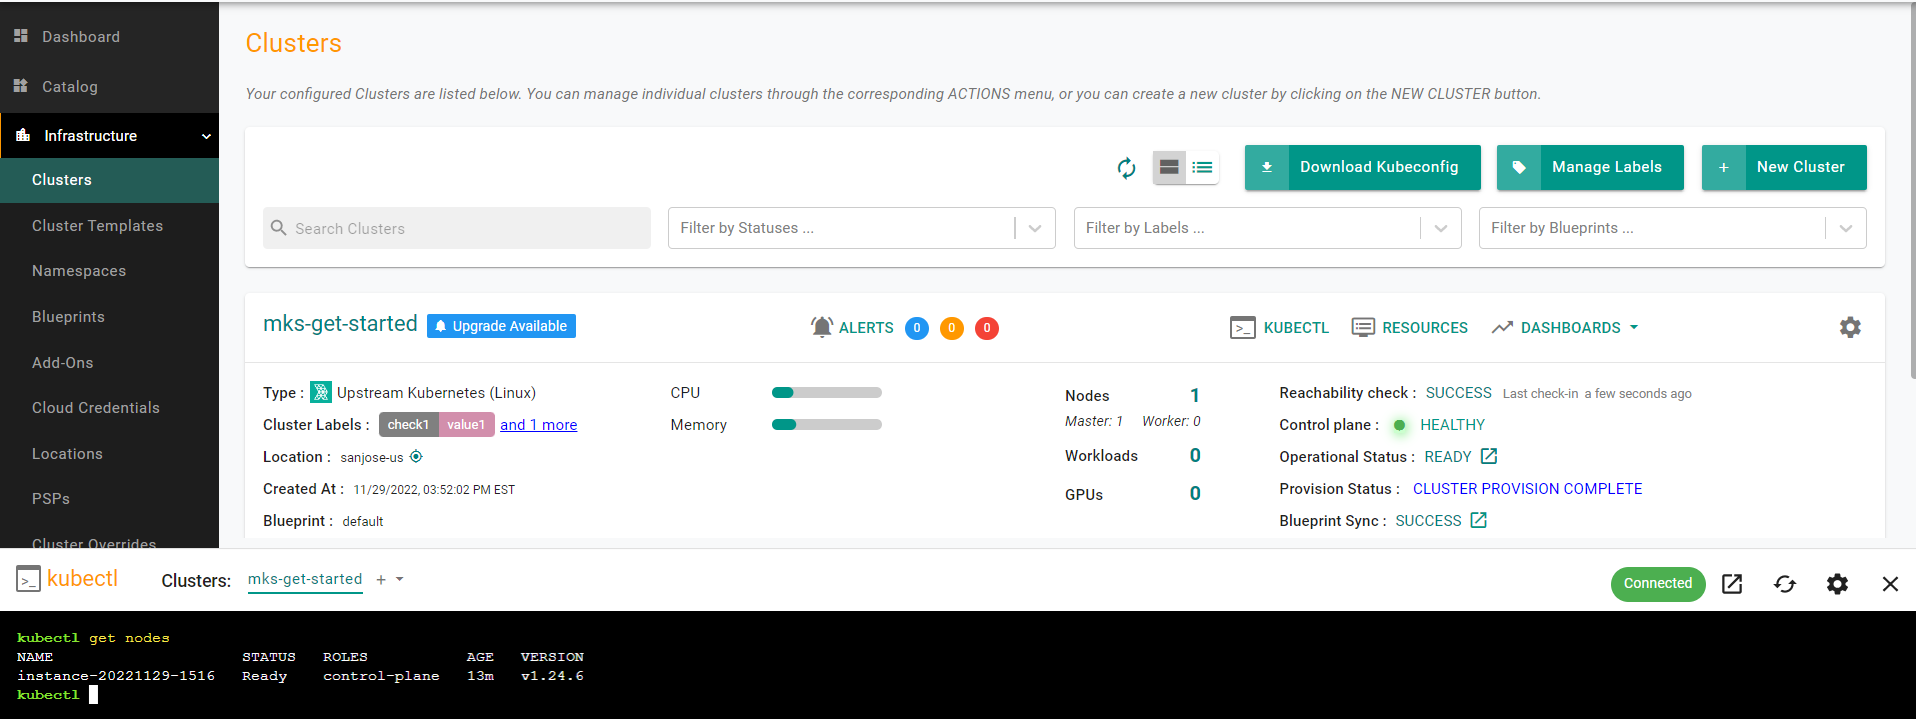
Step 4b : Zero Trust Kubectl
The controller provides a zero trust kubectl channel for authorized users.
- Click the "Kubectl" button on the cluster card.
- This will launch a web based kubectl shell for you to securely interact with the API server over a zero trust channel
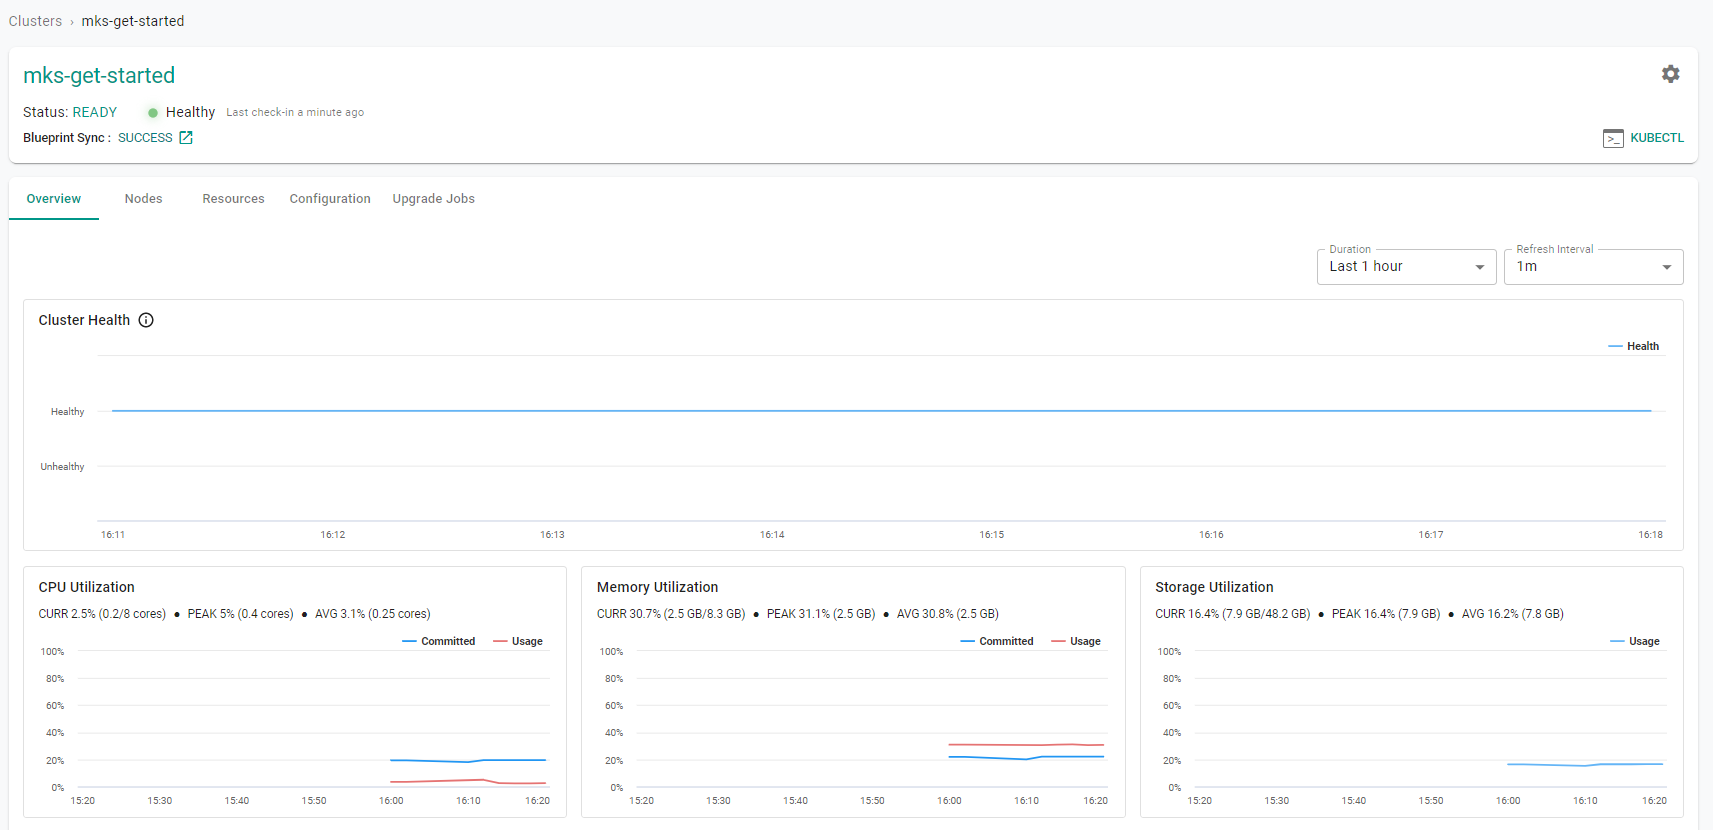
Step 5: Dashboards
The default cluster blueprint automatically deploys Prometheus and related components required to monitor the cluster. This data is aggregated from the cluster on the controller in a time series database. This data is then made available to administrators in the form of detailed dashboards.
Step 5a: Cluster Dashboard
Click on the cluster name to view the cluster dashboard. You will be presented with time series data for the following
- Cluster Health
- CPU Utilization
- Memory Utilization
- Storage Utilization
- Number of Worker Nodes
- Number of workloads and their status
- Number of pods and their status
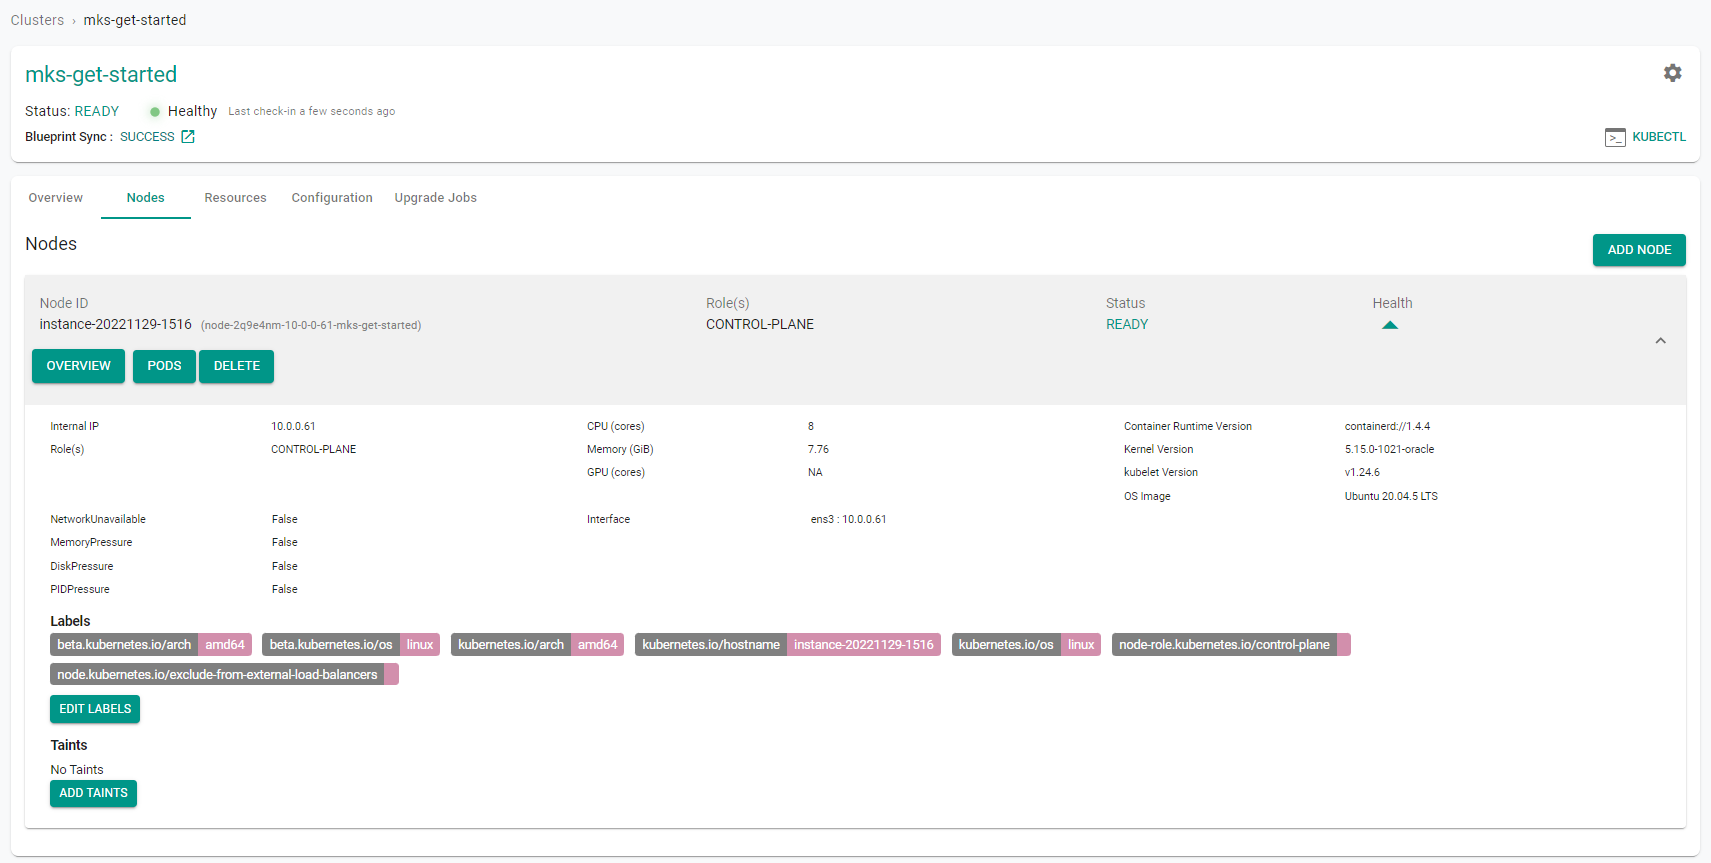
Step 5b: Node Dashboard
Click on the "Nodes" tab and then select a node to view the node dashboard.
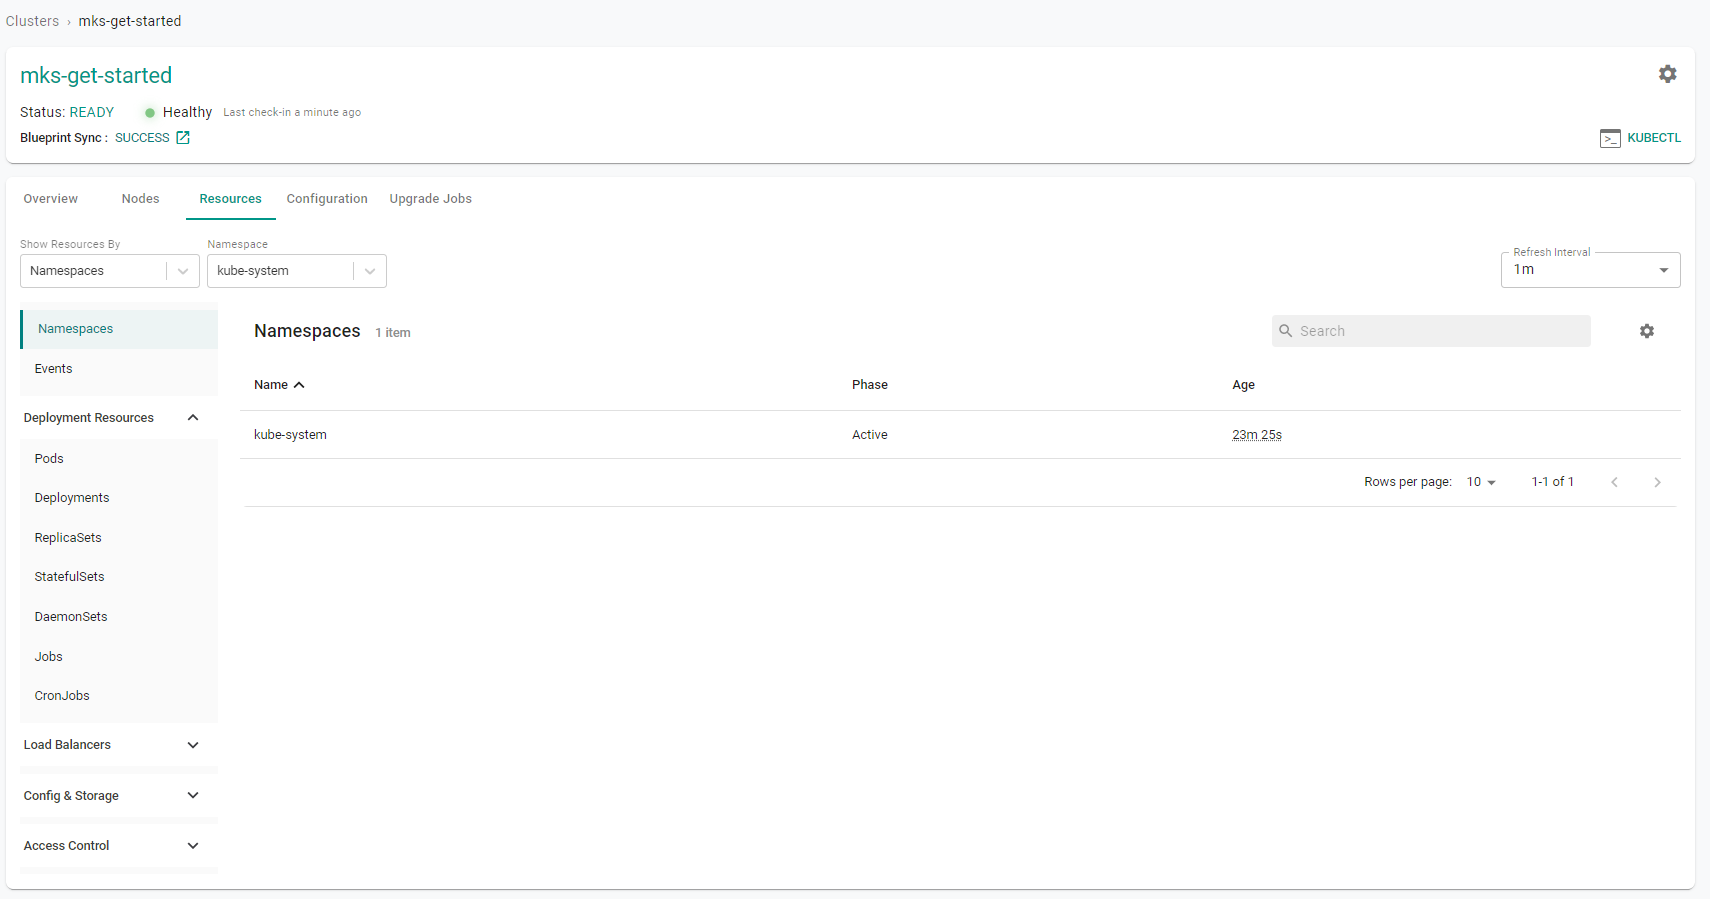
Step 5c: Kubernetes Resources
The dashboard also comes with an integrated Kubernetes dashboard.
- Click on "Resources" tab and you will be presented with all the Kubernetes resources organized using a number of filters.
Recap
Congratulations! At this point, you have
- Successfully configured and provisioned an MKS cluster
- Used zero trust kubectl to securely access the cluster's API server
- Used the integrated cluster, node and k8s dashboards to monitor and view details about the cluster