Configure
In this part, you will
- Create an Amazon Managed Service for Prometheus (AMP) workspace.
- Update and configure a Prometheus addon to perform remote writes to your AMP workspace.
- Create a custom cluster blueprint with the Prometheus addon.
- Apply the custom cluster blueprint on your EKS cluster.
Step 1: AMP Workspace
- Login into the AWS Console.
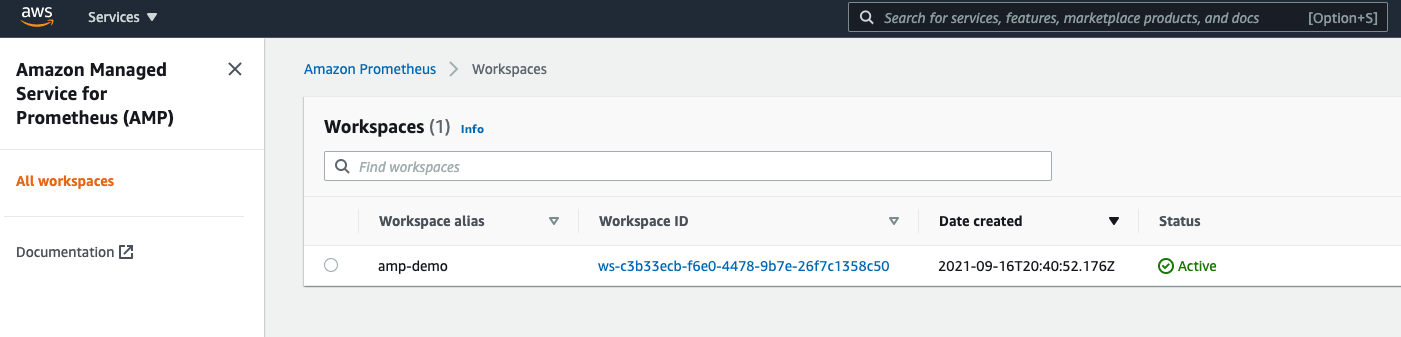
- Select the Amazon Prometheus service and create an AMP workspace.
In the example below, we have created our AMP workspace called "amp-demo" in the "us-east-1" AWS region.
Step 2: IRSA
In this step, you will create an IRSA so that the Prometheus pods on the EKS cluster will have the necessary permissions to perform "remote writes" to the AMP remote write endpoint. In AWS, it is a recommended best practice to use IAM roles for service accounts (IRSA) to access AWS services outside the EKS cluster because of the following benefits:
| Benefit | Description |
|---|---|
| Least Privilege | No longer need to provide extended permissions to the node IAM role so that pods on that node can call AWS APIs. You can scope IAM permissions to a service account, and only pods that use that service account have access to those permissions. This feature also eliminates the need for third-party solutions such as kiam or kube2iam. |
| Credential Isolation | A container can only retrieve credentials for the IAM role that is associated with the service account to which it belongs. A container never has access to credentials that are intended for another container that belongs to another pod. |
| Auditability | Access and event logging is available through CloudTrail to help ensure retrospective auditing. |
Create Namespace
We will deploy Prometheus to a namespace called "monitoring"
- Click on Infrastructure -> Namespace.
- Create a new namespace with the name "monitoring".
Create IRSA
In the example below, the EKS cluster's name is "amp-demo" and the IRSA name is "amp-irsa".
./rctl create iam-service-account amp-demo --name amp-irsa --namespace monitoring --policy-arn arn:aws:iam::aws:policy/AmazonPrometheusRemoteWriteAccess

Request submitted successfully to create IAM service account(s).
Verify IRSA
Creation of the IRSA can take a few seconds. You can verify the status of the IRSA by using RCTL
./rctl get iam-service-account amp-demo

[{"metadata":{"name":"amp-irsa","namespace":"monitoring"},"attachPolicyARNs":["arn:aws:iam::aws:policy/AmazonPrometheusRemoteWriteAccess"]}]
You can also verify that the k8s service account was created in the EKS cluster in the "monitoring" namespace.
- Click on the Zero Trust Kubectl Shell on the web console.
kubectl get sa -n monitoring

NAME       SECRETS   AGE
amp-irsa   1         2m33s
default    1         18m
As you can see in this example, the "amp-irsa" service account was successfully created in the "monitoring" namespace.
Step 3: Cluster Blueprint
In this step, you will
- Create a custom cluster blueprint with a Prometheus addon.
- Provide the Prometheus addon with custom values so that it has permissions to perform remote writes to the newly created AMP workspace in the previous step.
Add Prometheus Repo
Configure the Prometheus repo endpoint so that the controller can automatically retrieve the required Helm chart directly from the Internet facing repository.
- Click on Integrations -> Repository.
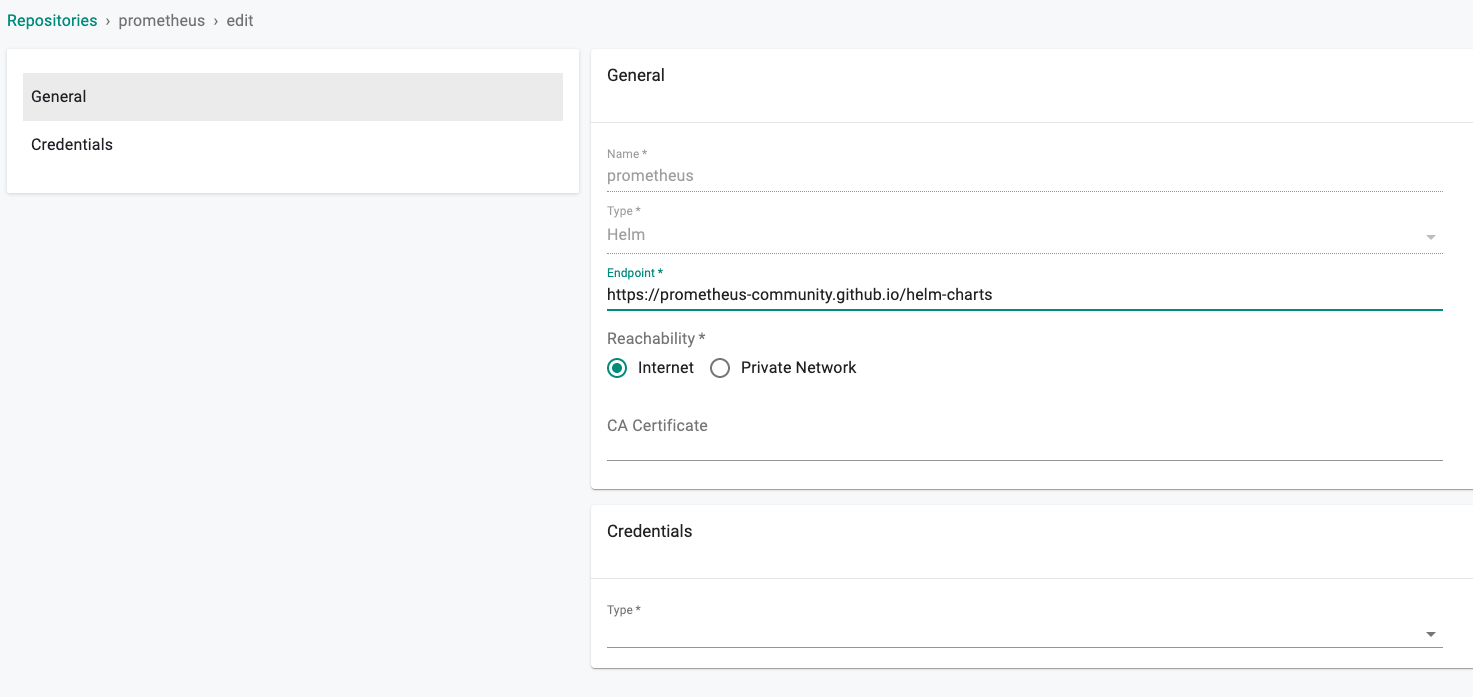
- Create New Repository -> Provide a name such as "prometheus" and Select "Helm" for Type.
- Enter "https://prometheus-community.github.io/helm-charts" for Endpoint and Select "Internet Facing" for Reachability.
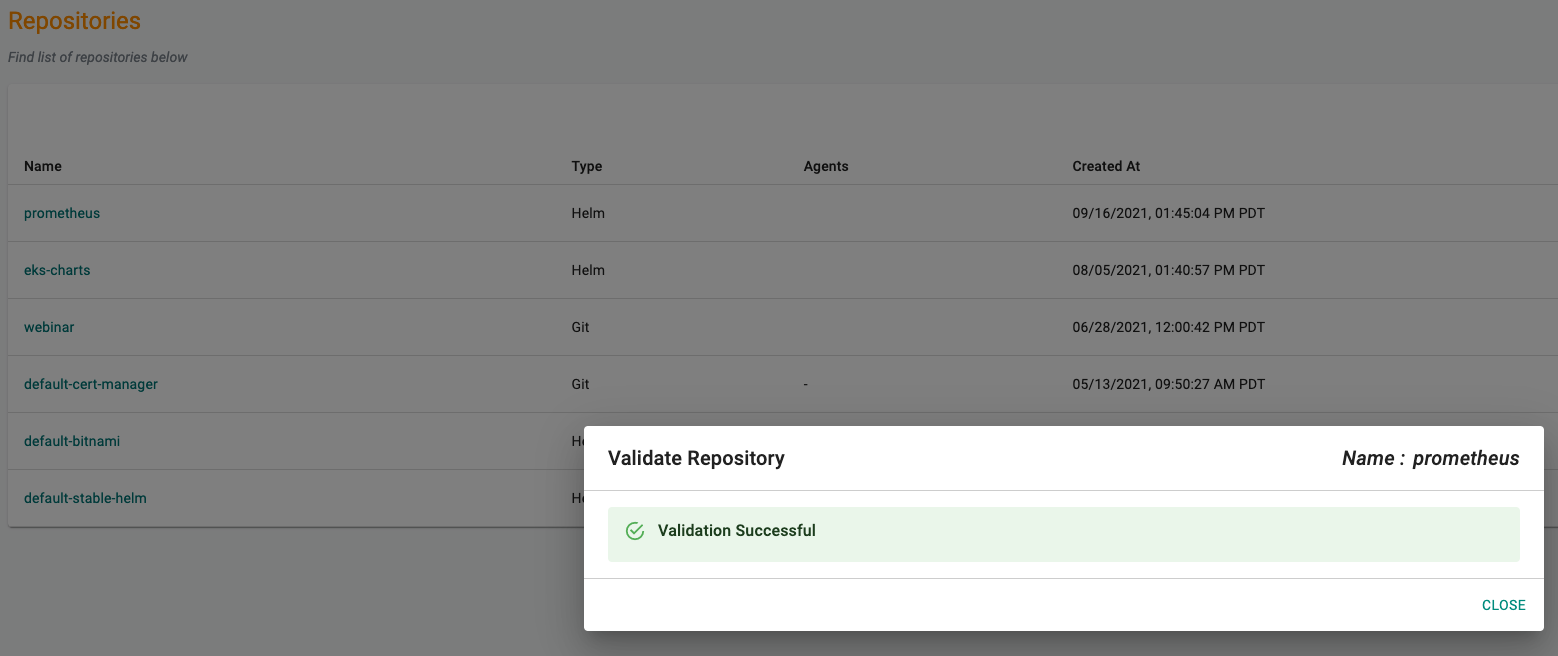
- Optionally, you can validate the correct configuration of the repository by clicking on the validate option.
Create Addon
- Click on Infrastructure -> Addons.
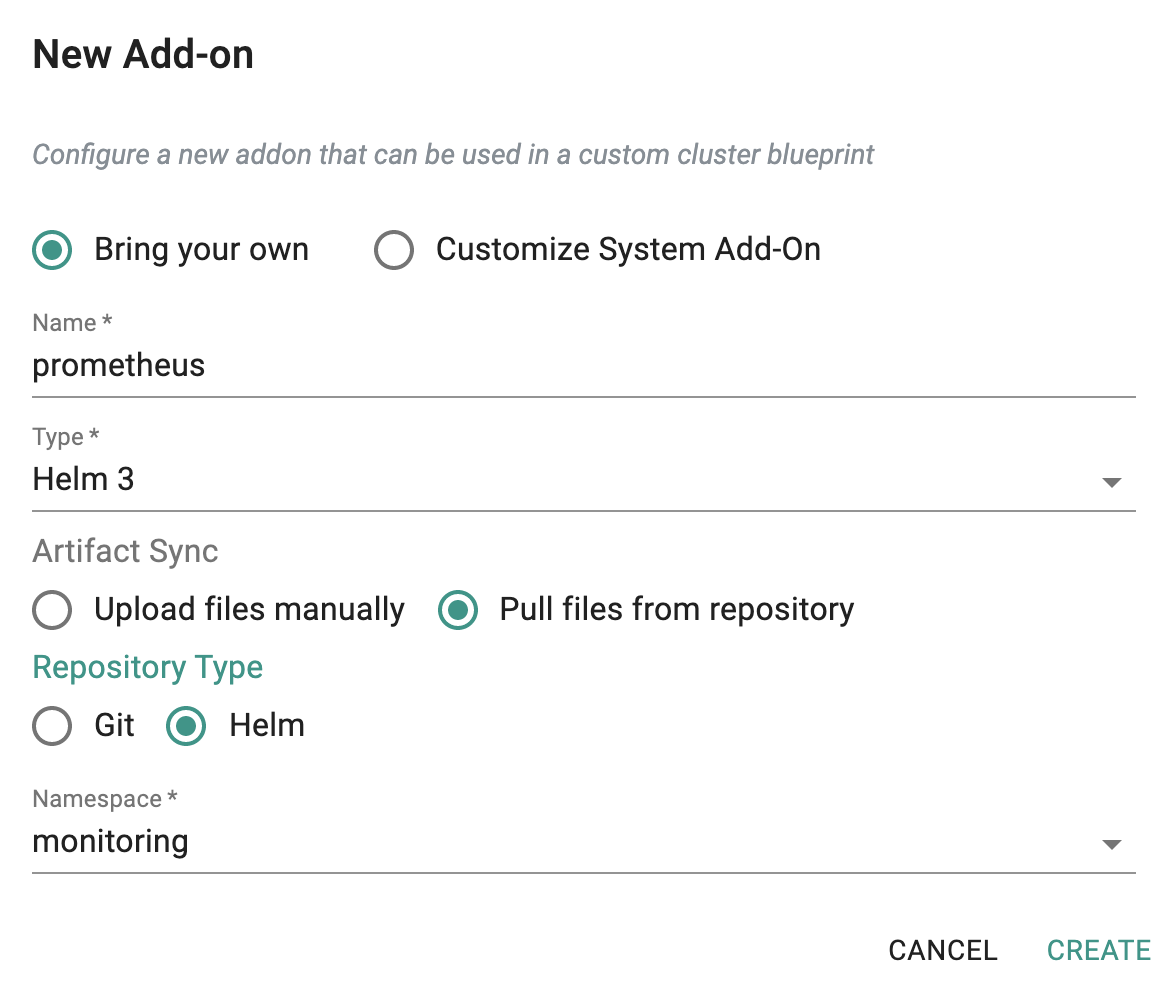
- Click on Create New Addon with the name "prometheus".
- Select "Helm3" for addon type.
- Select "Pull files from repository" for Artifact Sync.
- Select repository type as "helm".
- Select the "monitoring" namespace from the dropdown.
Custom Values
We need to customize the Prometheus addon with an override "values file" comprising the following:
- The IRSA for Prometheus to perform remote writes to the AMP endpoint
- The AMP remote write endpoint URL details (from AWS Console)
-
The AWS region for the AMP workspace
-
Save the YAML provided below to a file and update the fields appropriately.
- Add the values.yaml file to the addon as an override.
rbac:
  create: true
serviceAccounts:
  server:
    create: false
    name: <EKS cluster's IRSA>
alertmanager:
  enabled: false
alertmanagerFiles:
  alertmanager.yml: ""
kubeStateMetrics:
  enabled: false
nodeExporter:
  enabled: false
pushgateway:
  enabled: false
server:
  remoteWrite:
    - url: <AMP Remote Write URL>
      sigv4:
        region: <AWS Region for the AMP workspace>
      queue_config:
        max_samples_per_send: 1000
        max_shards: 200
        capacity: 2500
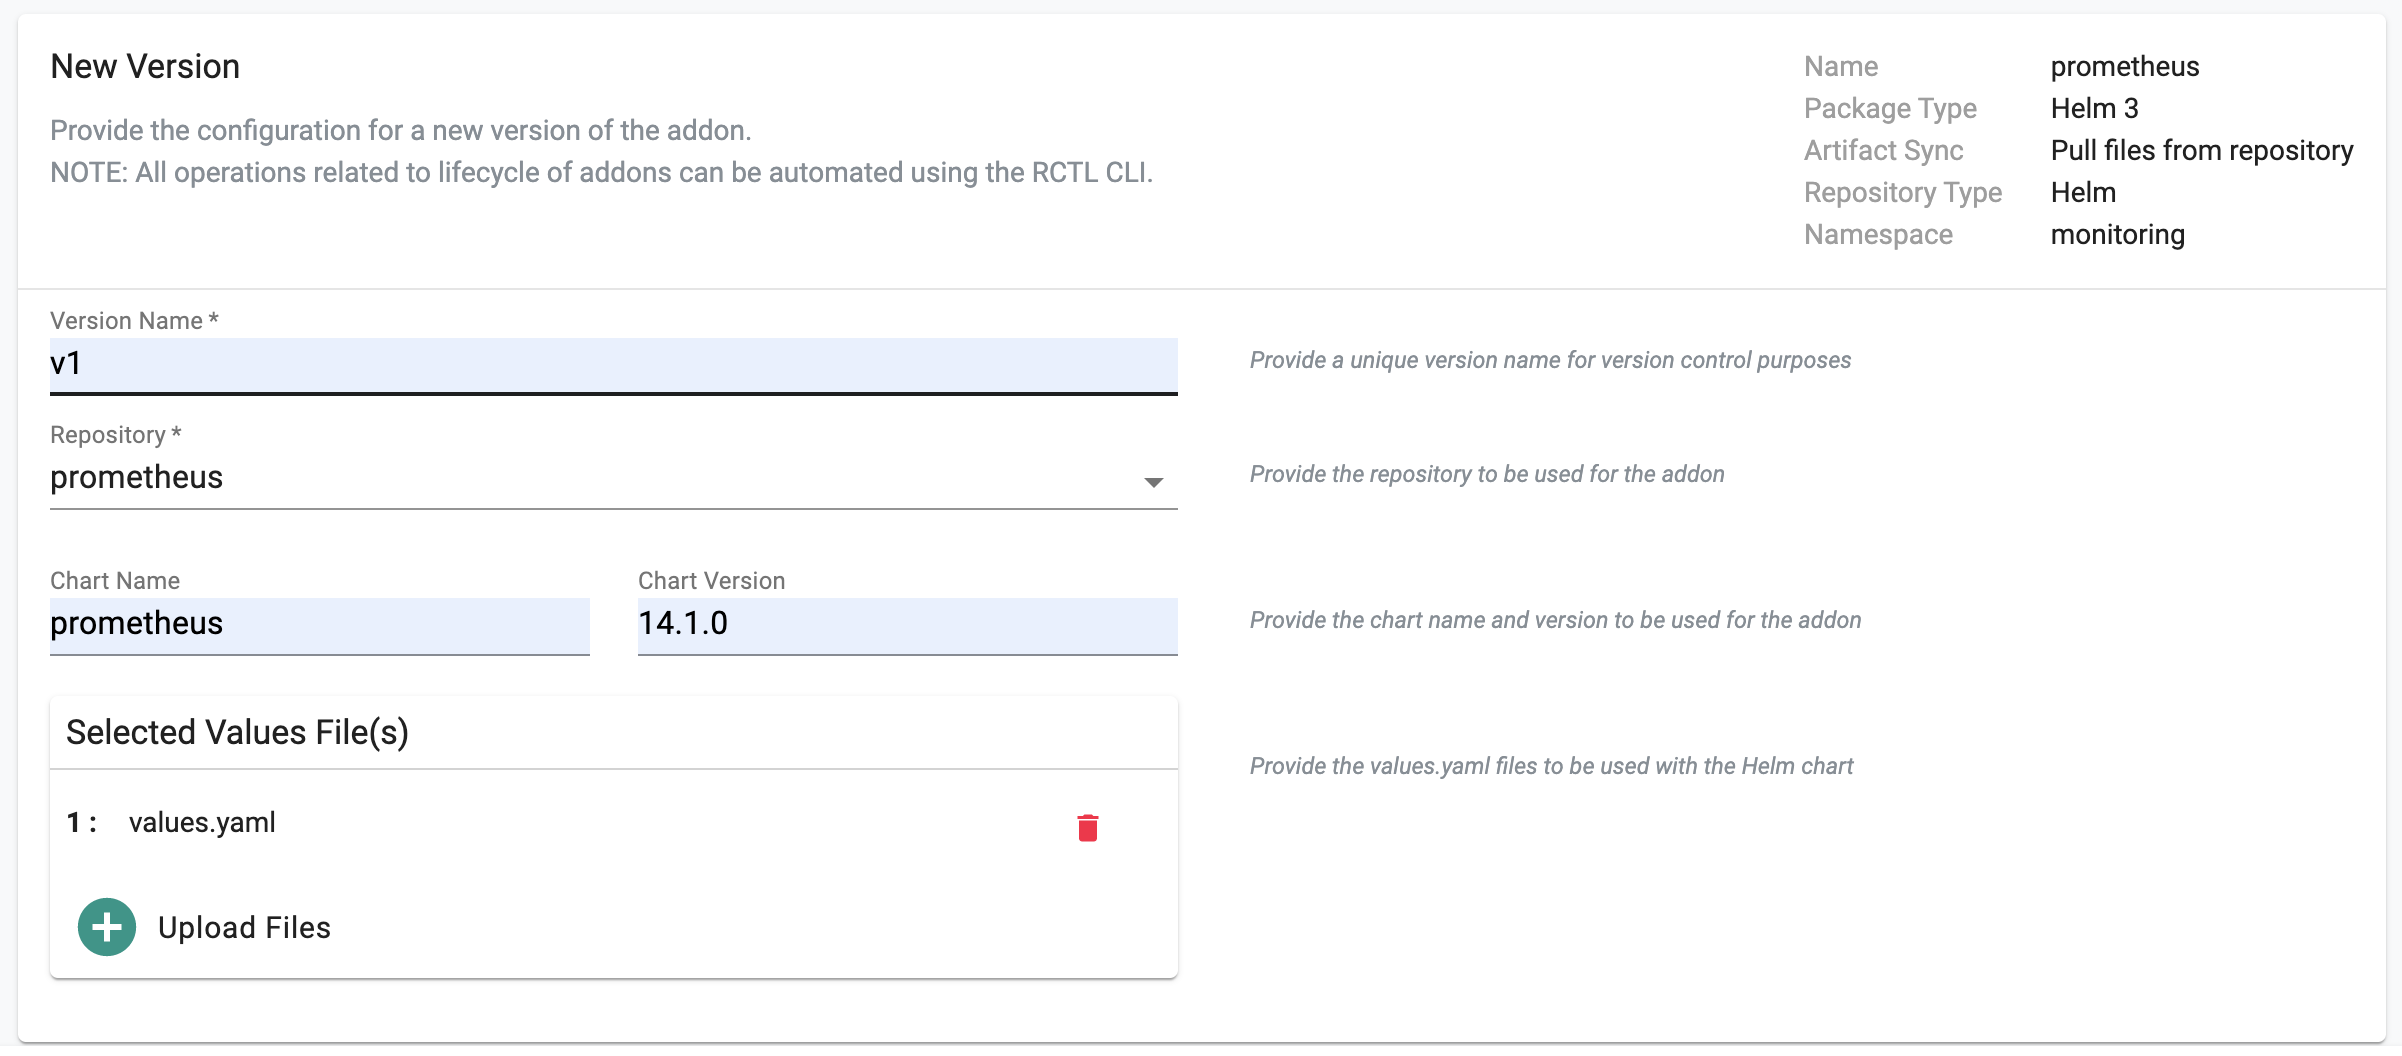
New Addon Version
- Click on "New Version" to create a new version of the prometheus addon.
- Provide a version (e.g. v1).
- Select the "prometheus" repository.
- Enter "prometheus" for the Chart Name.
- Enter "14.1.0" for the version number.
- Upload the custom values file from the previous step.
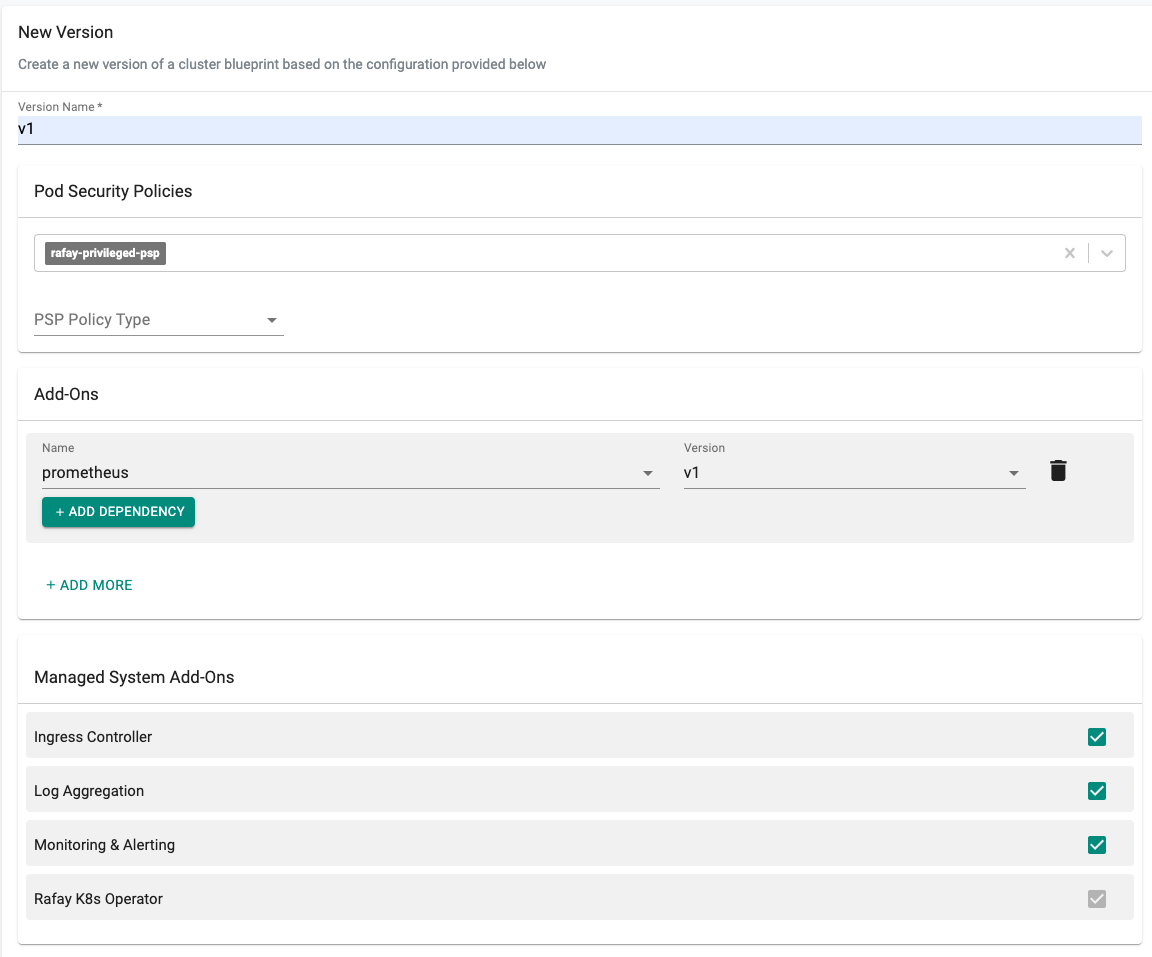
New Blueprint
- Select blueprints and create a new blueprint (e.g. amp).
- Click on "New version" (e.g. v1).
- Select the "prometheus" addon and "version" from the list of custom addons.
- Save blueprint.
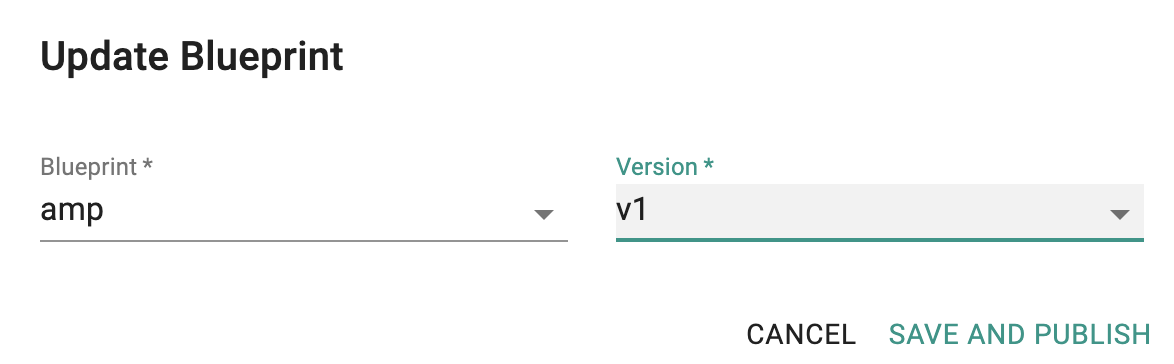
Step 4: Apply Blueprint
Now, we are ready to apply the newly created, custom blueprint to our EKS cluster.
- Select Infrastructure -> Clusters.
- Click on the gear icon on the far right of the EKS cluster.
- Update blueprint and select the new blueprint and version.
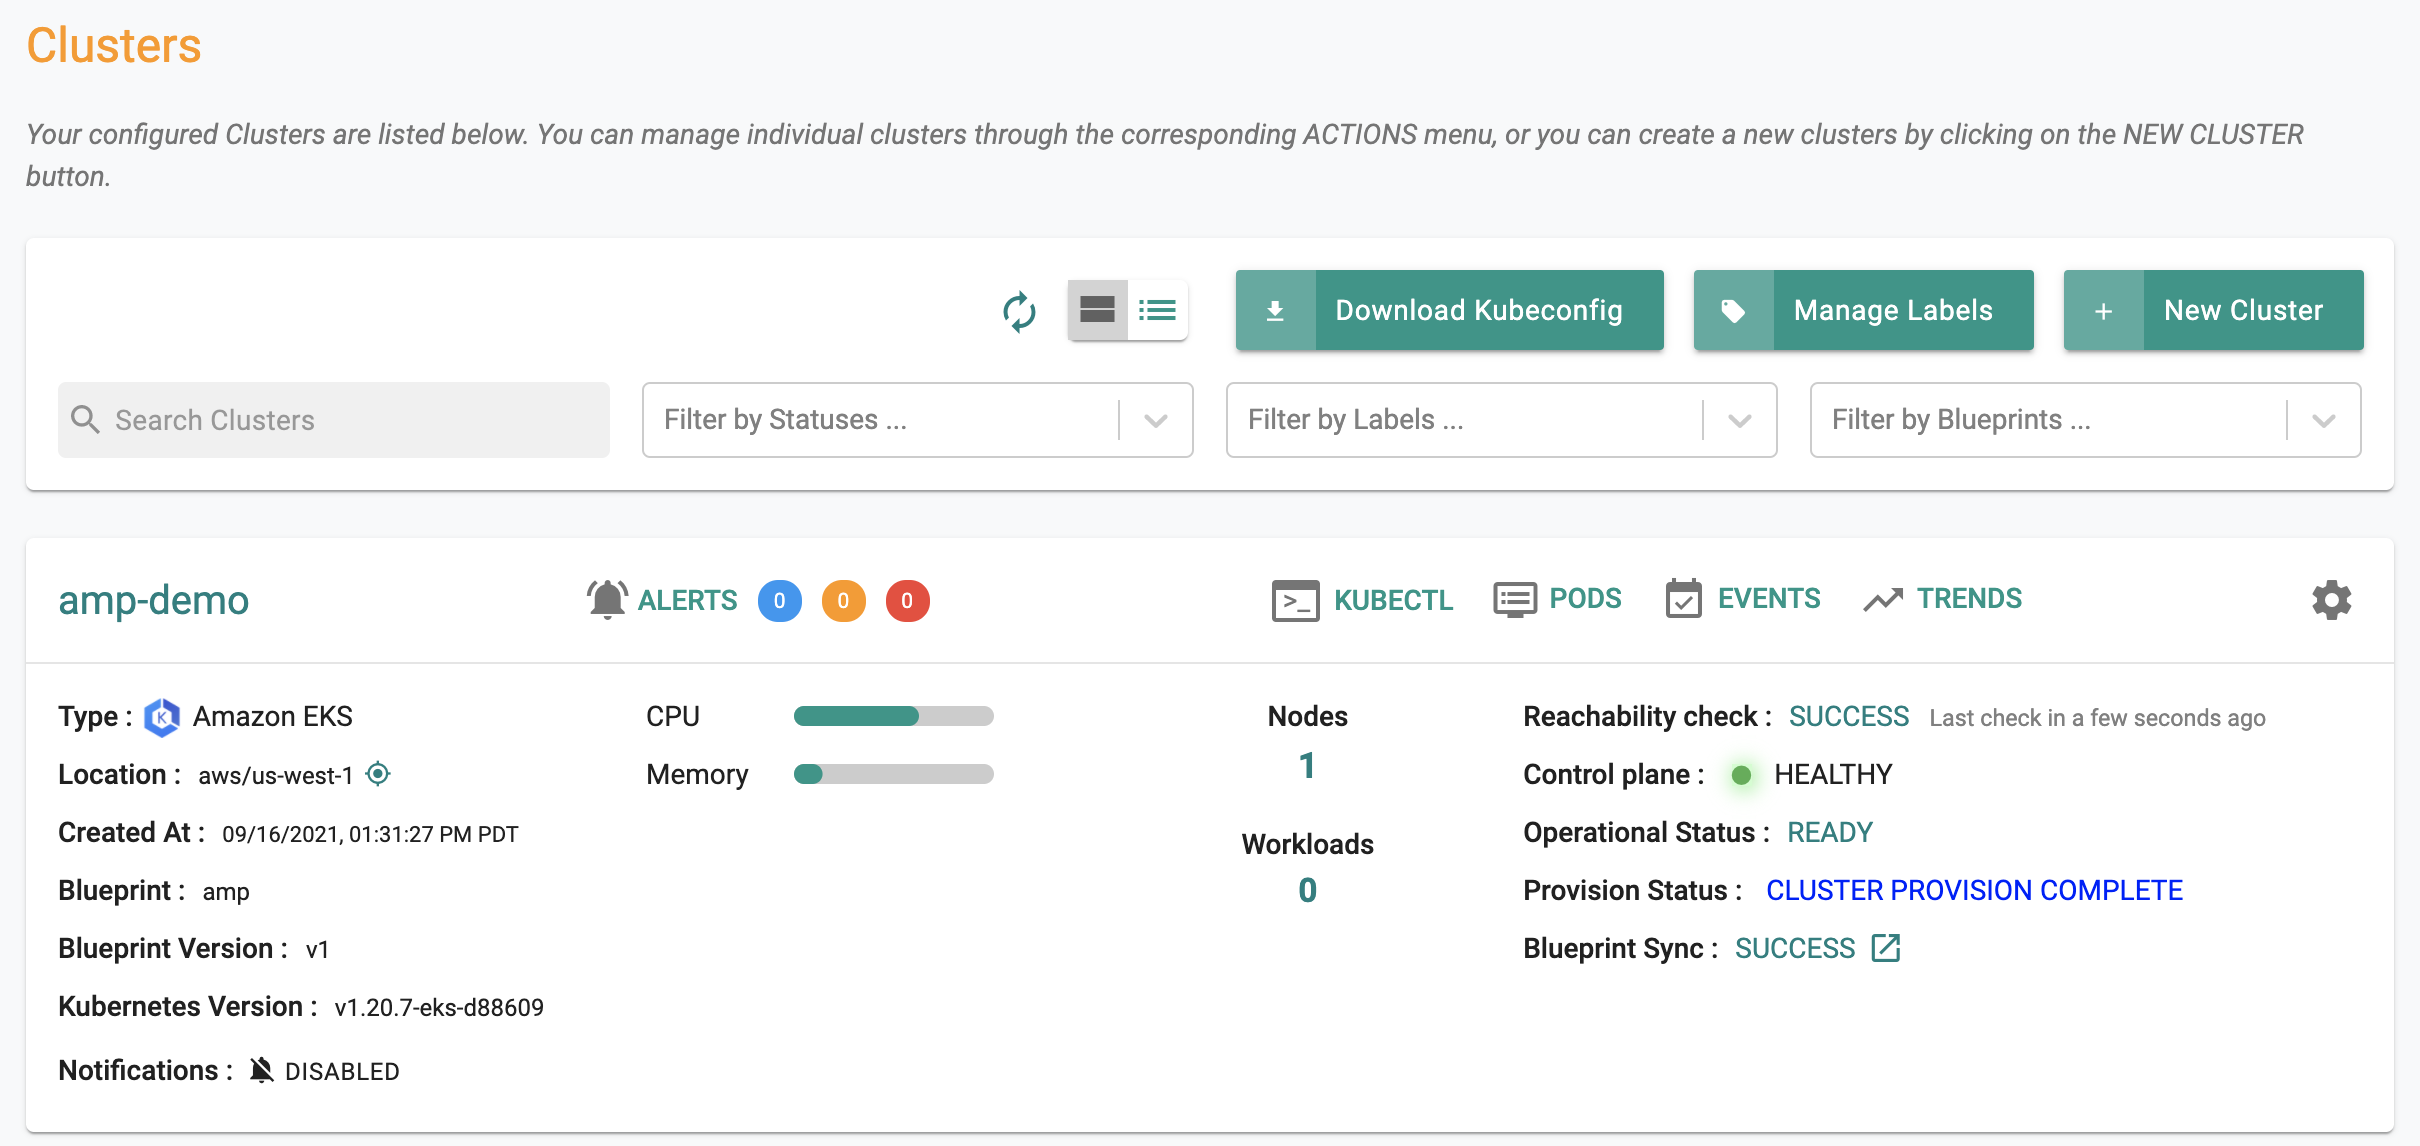
In a few minutes, all the k8s resources matching the custom cluster blueprint will become operational on the cluster. Notice that the cluster's blueprint name and version match what you created in the prior step.
Step 5: Verify Setup
Optionally, to verify if Prometheus is able to remote write to the AMP workspace
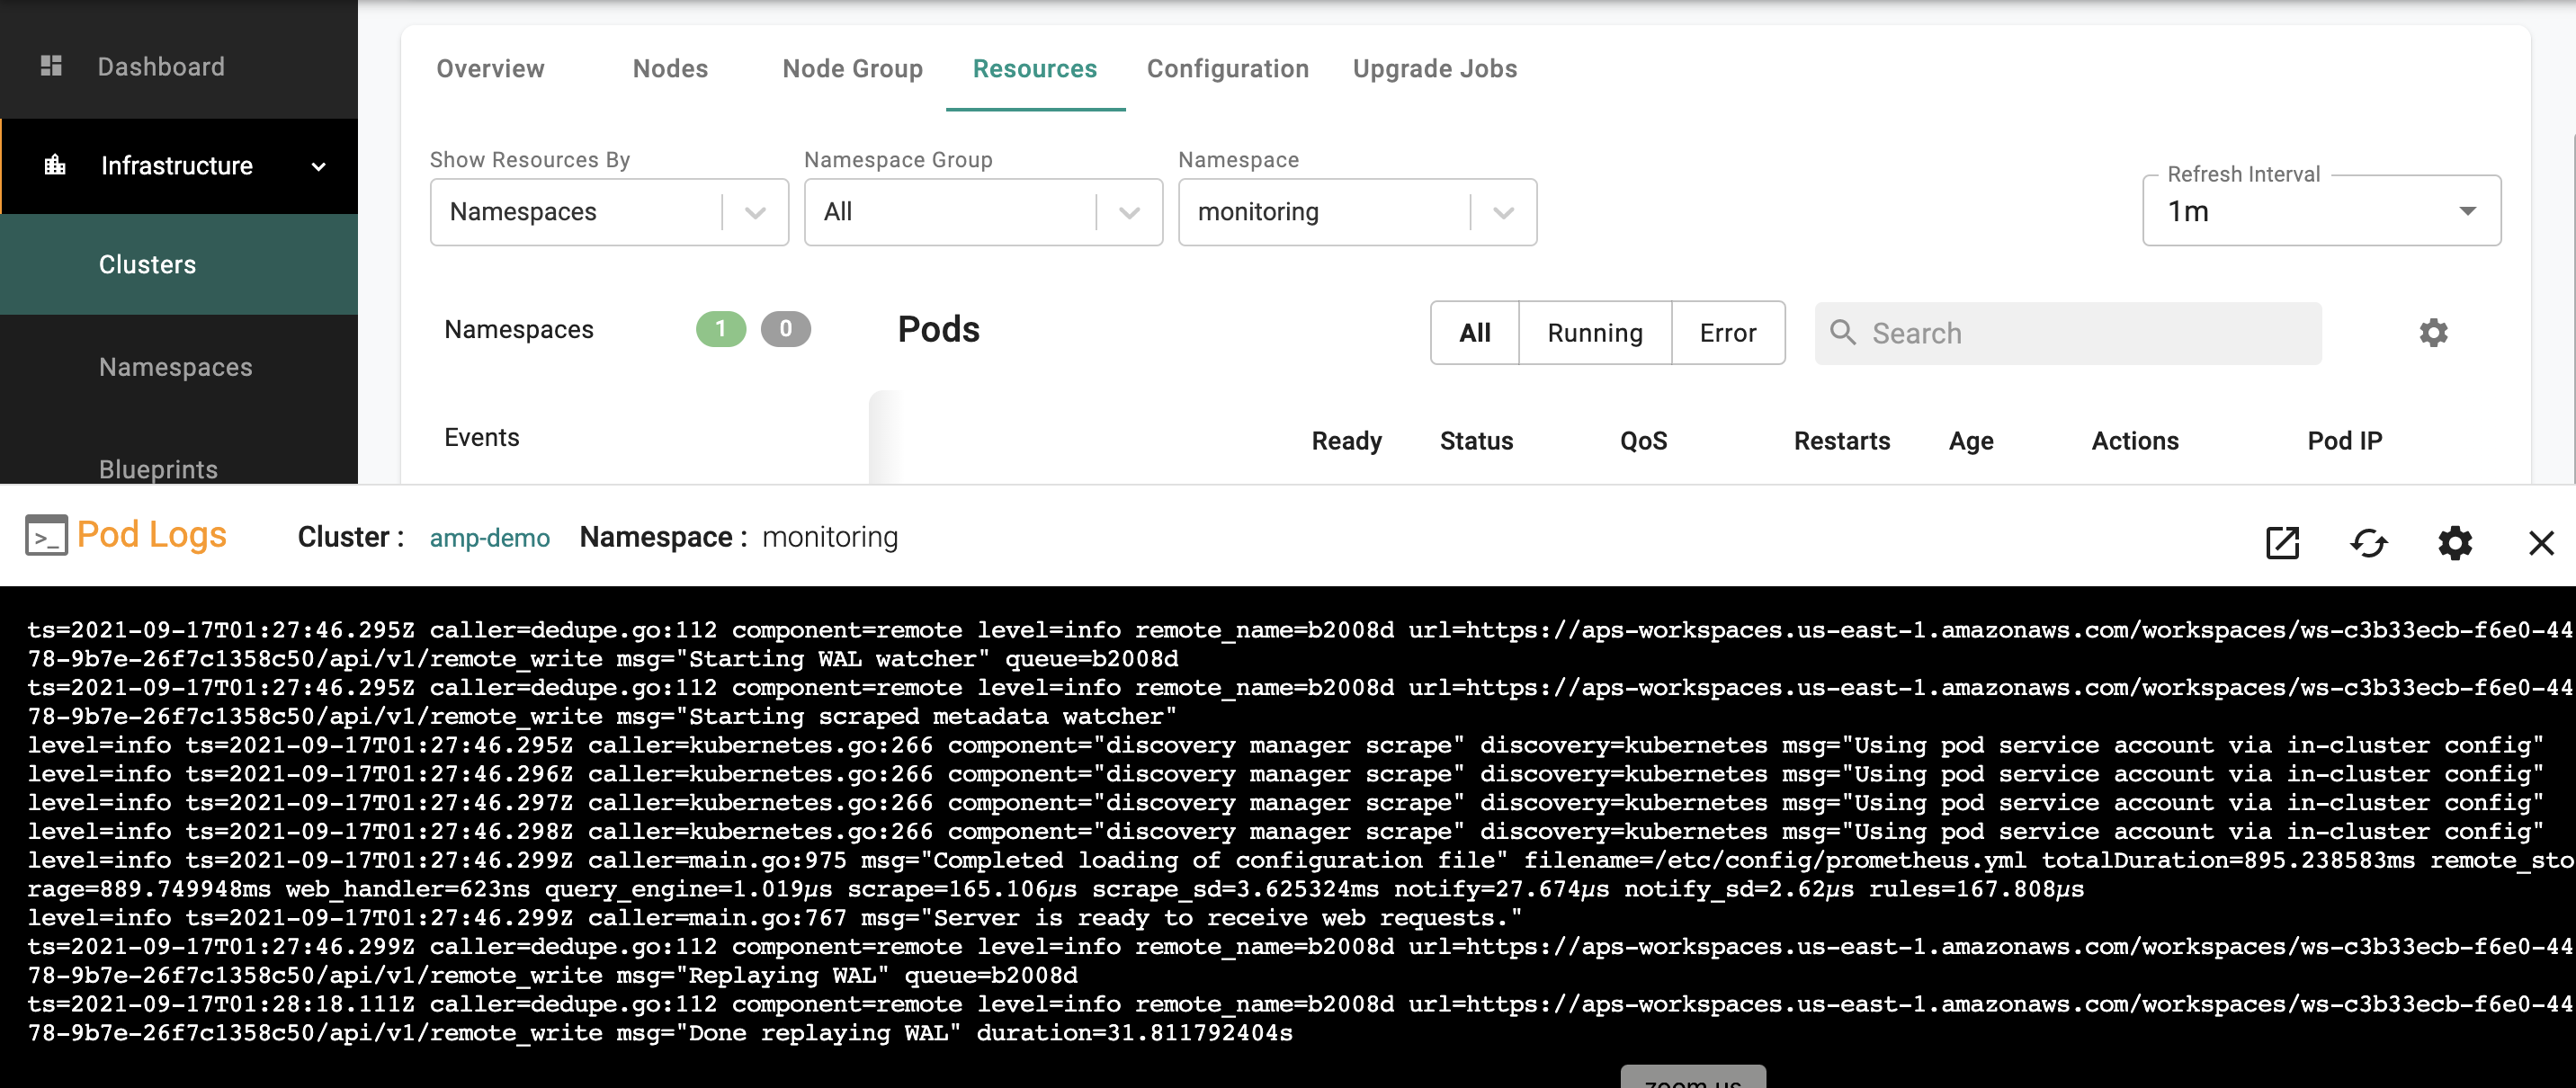
- Click on the EKS cluster.
- Select Resources to view the integrated k8s dashboard.
- Select "pods" from the resource selector and filter by the "monitoring" namespace.
- Under actions for the "prometheus" pod, click on "logs" for the "prometheus server" container.
Next Steps
You are now ready to move on to the next part of the recipe where you will access and visualize the time series data aggregated in your AMP Workspace using Grafana.