Projects
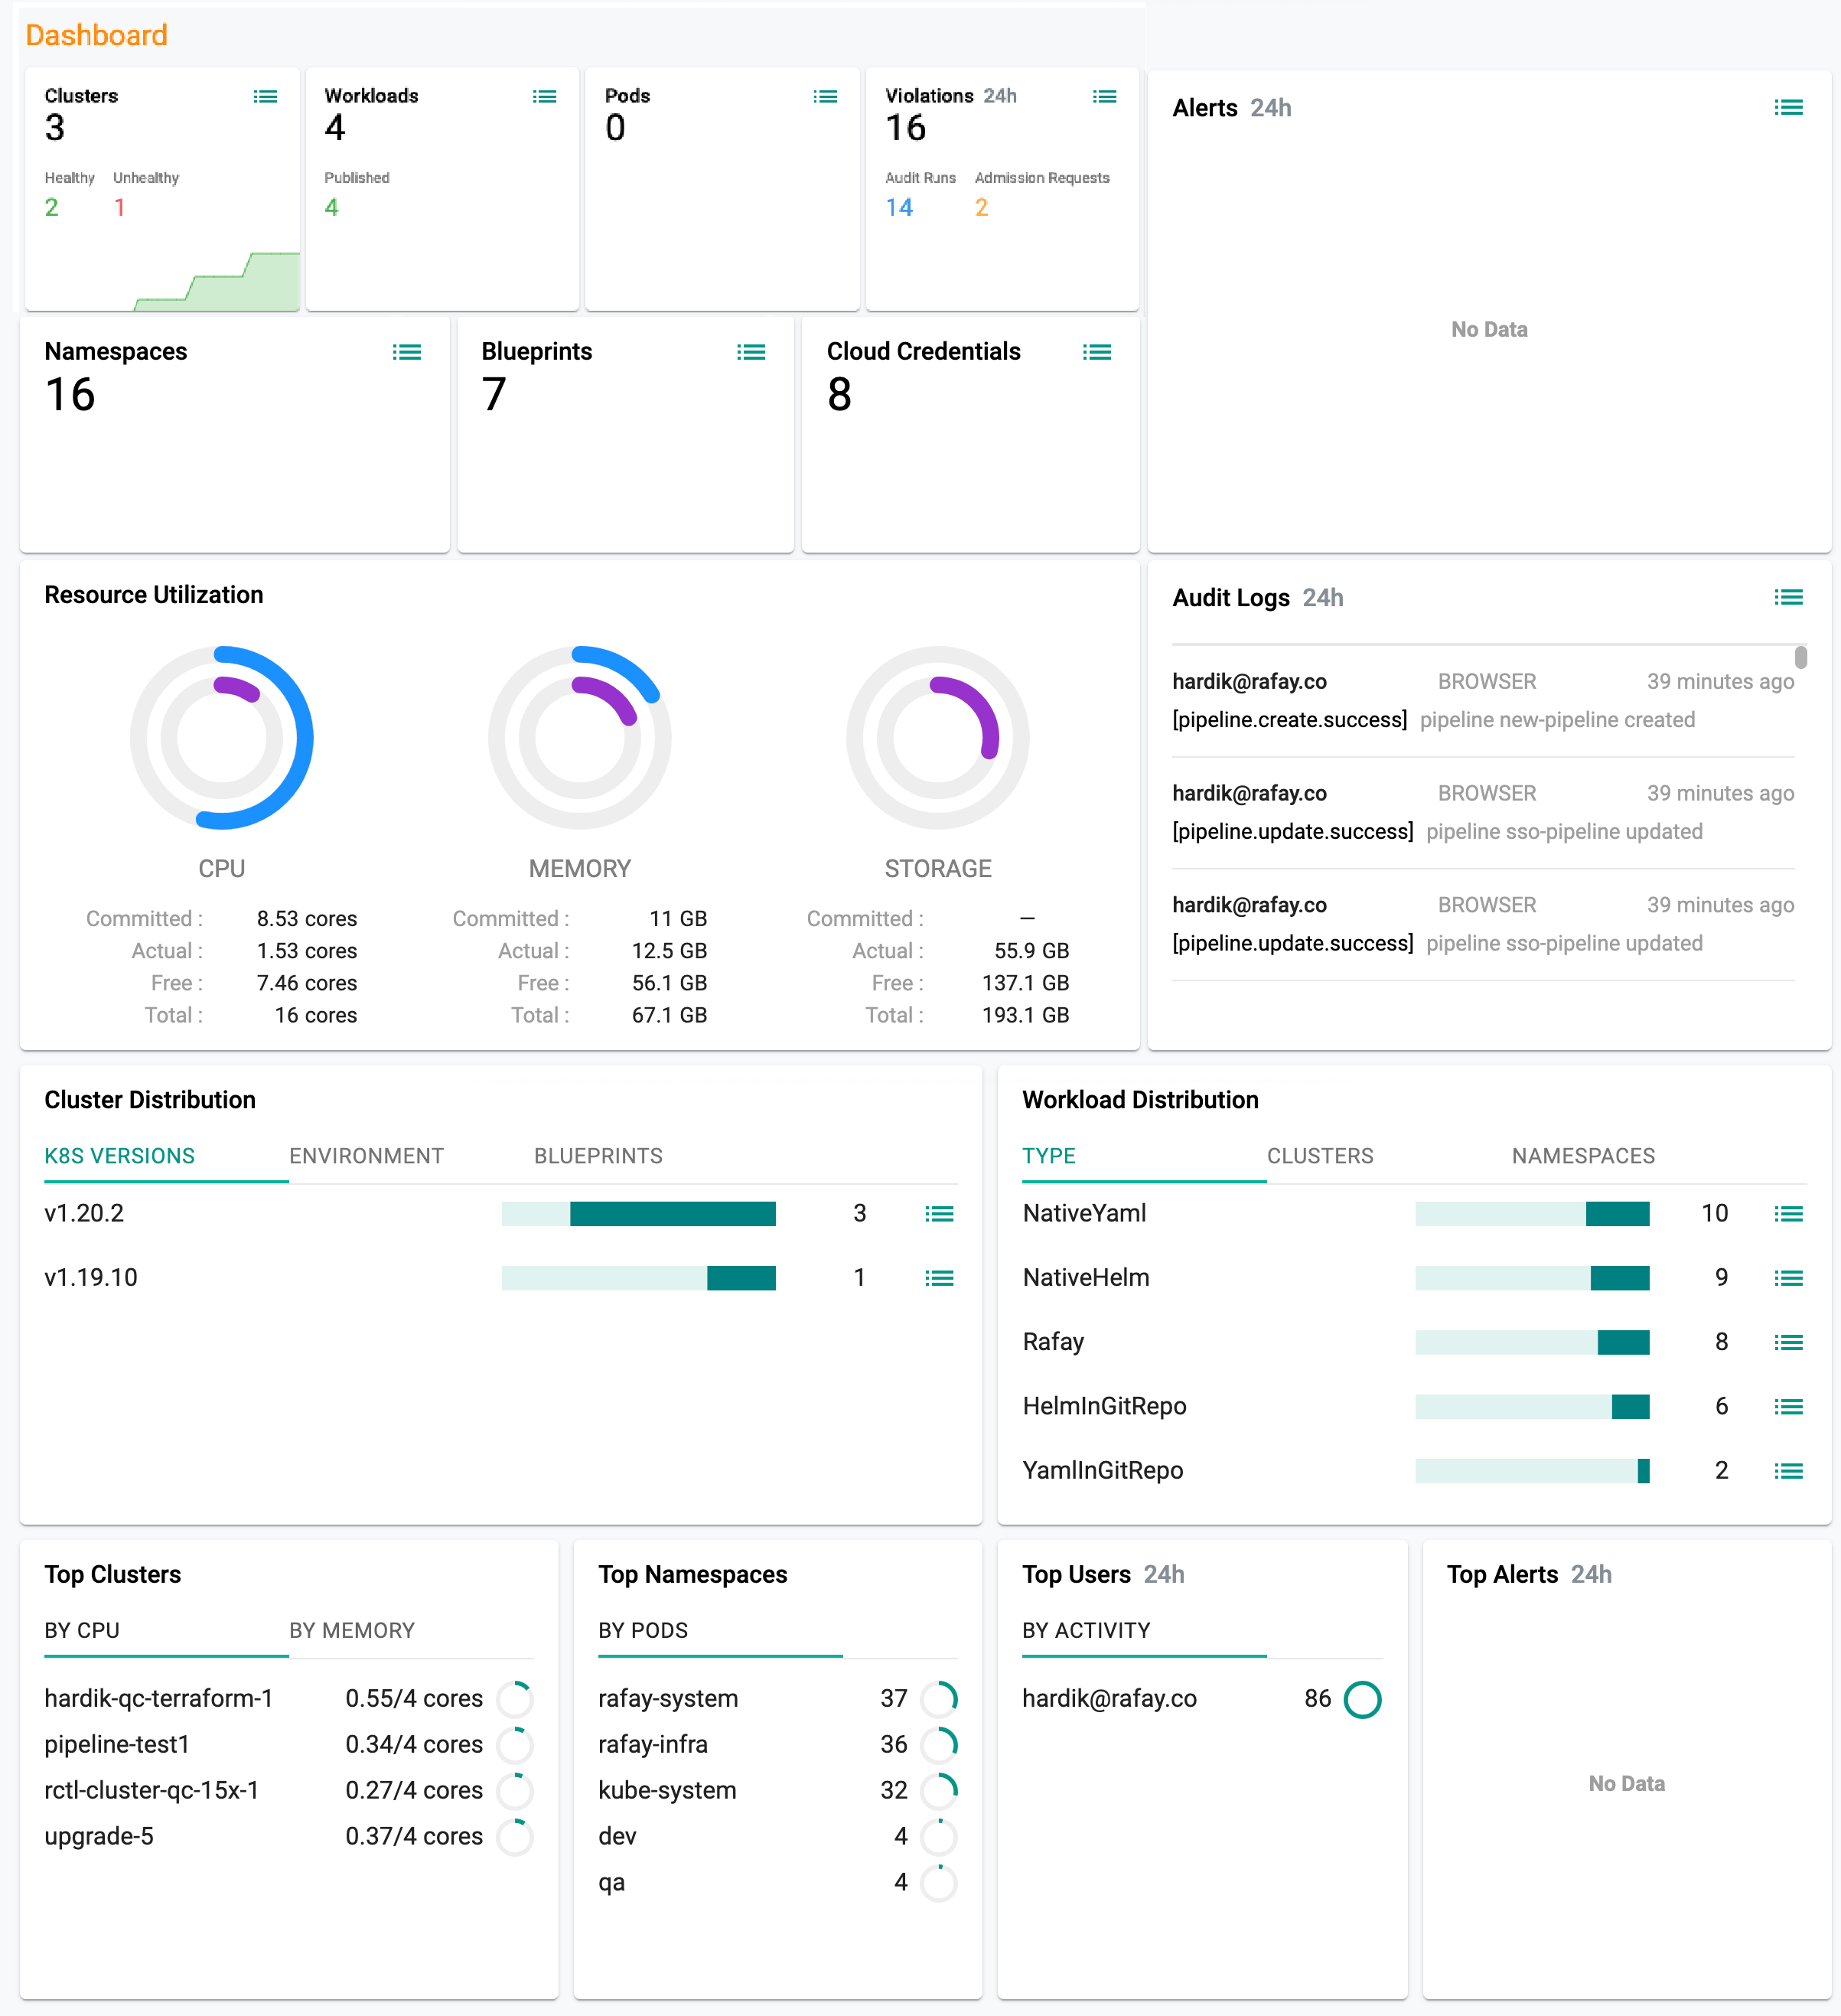
A detailed dashboard is available for every Project providing a "birds eye view" of all critical assets and activity spanning all clusters, workloads and users in the project. The Project Dashboard is accessible to all users that have access to the Project. An example of the Project Dashboard is shown below.
Clusters
The total number of Clusters currently under management as well as a trend of the number of clusters. The admin is also provided a break down by "Healthy" and "Unhealthy" Clusters.
Workloads
The total number of Workloads currently under management. The user is also provided a view into how many are "published".
Pods
The total number of pods across all clusters in the project. The user is also provided a quick view into how many pods are running and how many are in an error state.
Pods
The total number of pods across all clusters in the project. The user is also provided a quick view into how many pods are running and how many are in an error state.
OPA Violations
Total number of policy violations for that specific project over the last 24 hours time period.
Audit Runs
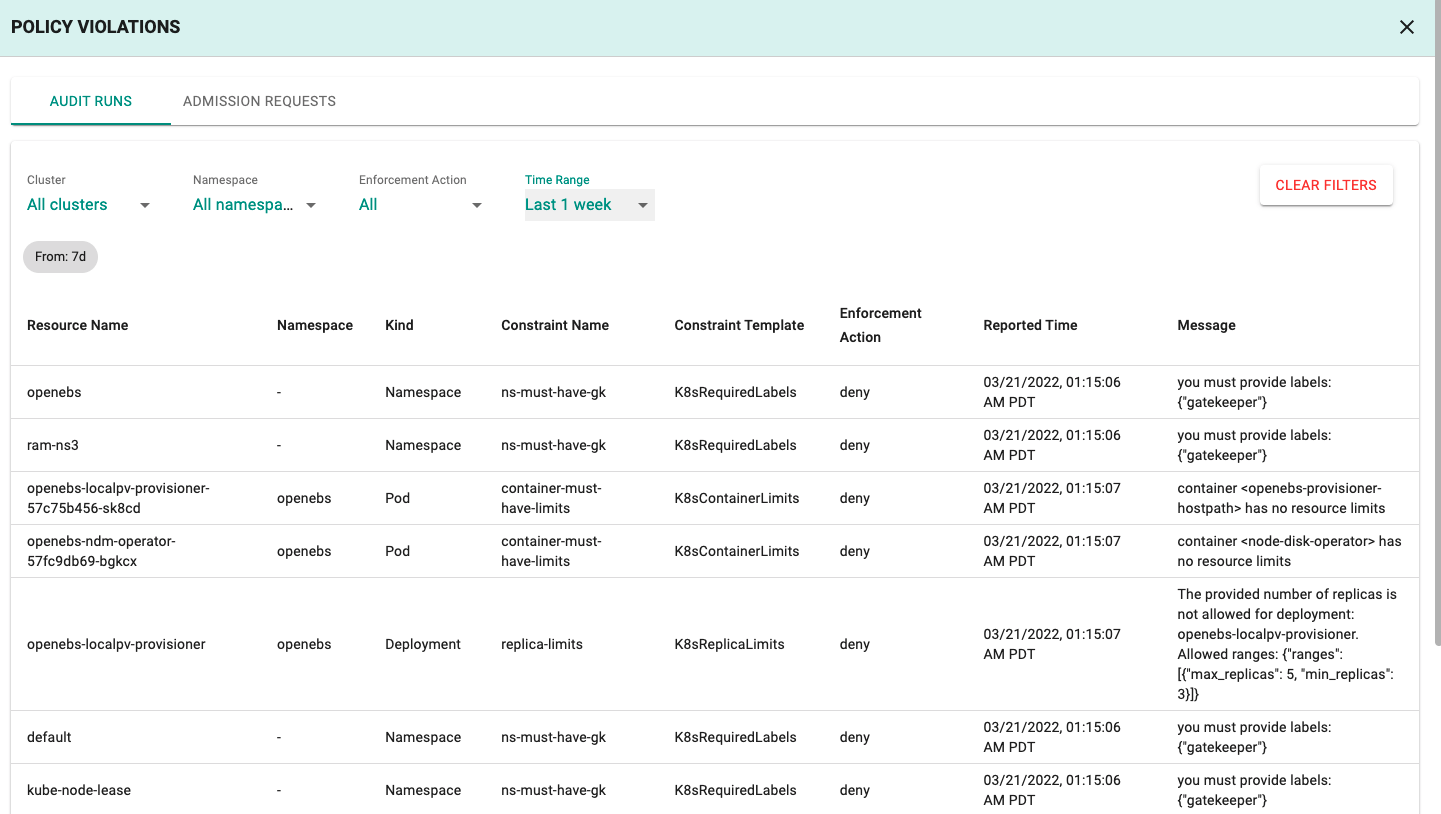
Audit Runs shows the number of violations on the resources that are currently running in the clusters. - Click on the count or View list (AUDIT RUNS) to view the list of violation(s) - Users can filter the data based on the requirement (e.g., Clusters, Namespaces)
Admission Requests
Admission Requests shows the number of violations when a user attempts to create. update or delete a resource that does not comply with the configured policy on the cluster. - Click on the count or View List (ADMISSION REQUESTS) to view the list of violation(s) - Users can filter the data based on the requirement (e.g., Clusters, Namespaces)
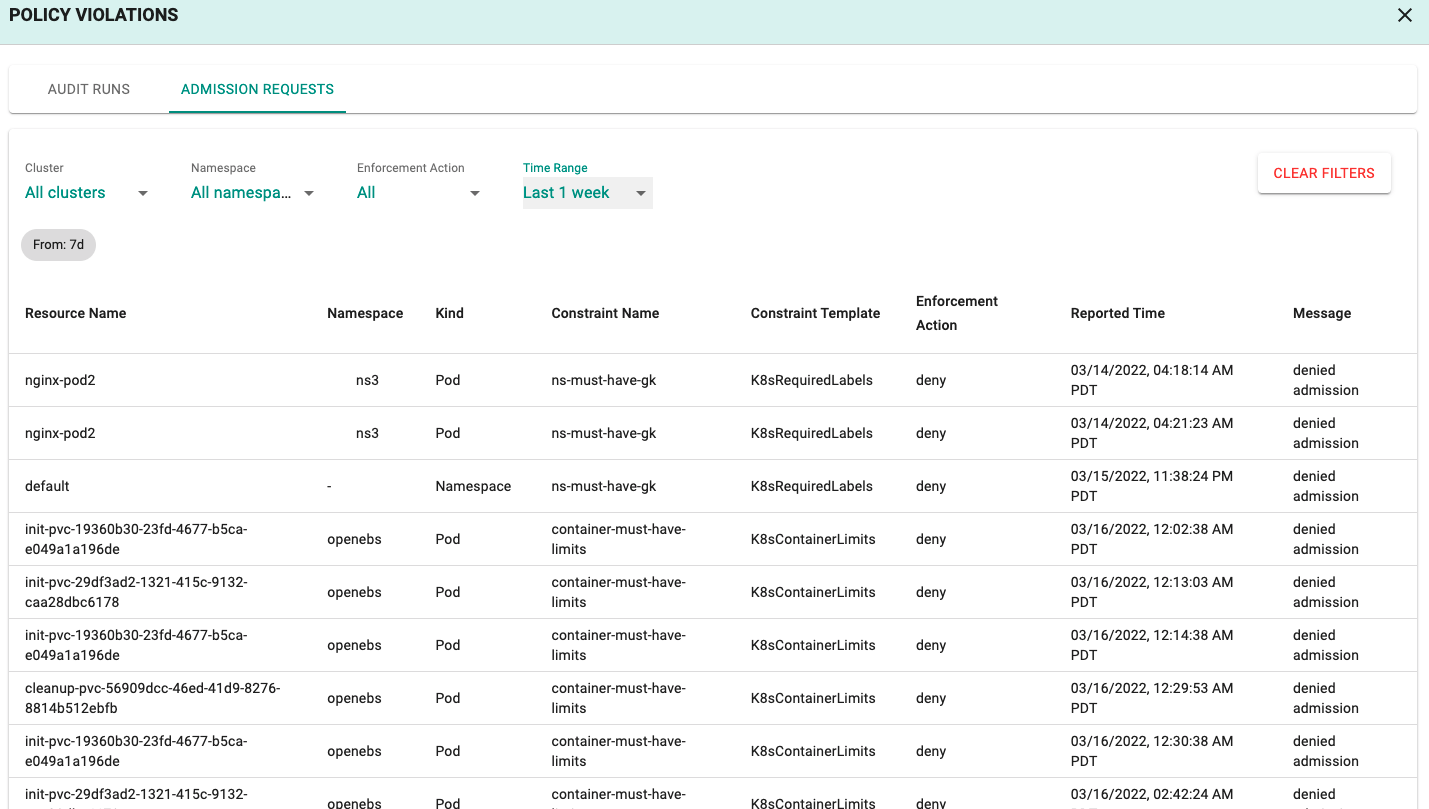
Notes: The violation count in the project dashboard can be any number whereas, Audit Runs and Admission Requests screens can show maximum of 3500 data in the table
Namespaces
The total number of namespaces across all clusters in the project.
Blueprints
The total number of blueprints in the project
Cloud Credentials
The total number of cloud credentials in the project.
Alerts
A running list of OPEN alerts generated in the project over the last 24 hour time period. You can set the project level notifications for one or more users
Audit Logs
A running list of audit entries generated in the project over the last 24 hour time period.
Resource Utilization
Resource utilization for CPU, Memory and Storage across the entire cluster fleet is calculated and presented. Data is displayed by "Commits", "Actual" and "Free" clearly highlighting opportunities for tuning and optimization.
Cluster Distribution
Administrators are provided views of their org wide cluster fleet by various filters.
By Environment
Get a view of cluster count by environment (Upstream Kubernetes, Amazon EKS, Imported etc)
By Kubernetes Version
Get a view of cluster count by Kubernetes version. This can be critical for governance and can help organizations quickly prioritize which clusters need to be upgraded first.
By Blueprint
Get a view of cluster count by cluster blueprint
Workload Distribution
Administrators are provided a view of all workloads spanning all clusters in the project.
By Type
Get a view of workload count by type (k8s YAML, Helm, Workload Wizard etc.)
By Clusters
Get a view of workload count by cluster
By Namespaces
Get a view of cluster count by namespace
Top Clusters
The top 5 clusters under management organized by resource utilization showcasing the busiest/most utilized clusters.
By CPU
The top 5 clusters by CPU showing both "actual" utilization and "total" available cores.
By Memory
The top 5 clusters by Memory showing both "actual" utilization and "total" available memory in GB.
Top Namespaces
Top 5 namespaces organized by "number of pods" providing a view into usage of namespaces.
Top Users
The top 5 clusters under management organized by user activity over the last 24 hours. This can highlight the most active users in the Organization and identify potential anomalies that may require immediate investigation.
By System Activity
Total number of unique audit entries resulting from user initiated actions (via the web console, RCTL CLI and REST API) over the last 24 hours.
By Kubectl Activity
Total number of unique audit entries resulting from user initiated actions via the zero trust kubectl channel (via both browser and Kubectl CLI) over the last 24 hours.
Top Alerts
Total number of OPEN alerts over the last 24 hours organized by Alert Type.