Monitoring Kubernetes Environments using Rafay
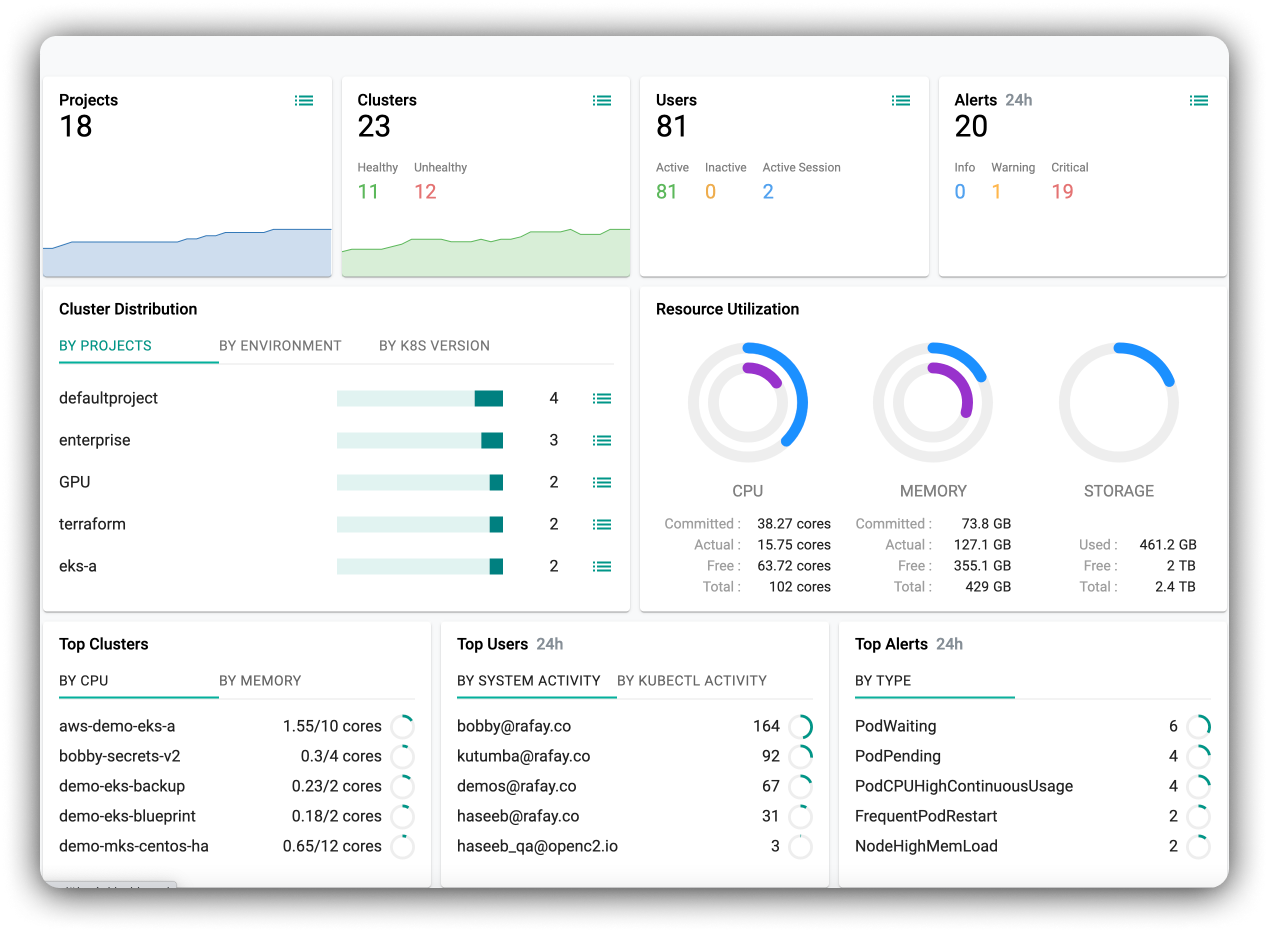
Rafay is a Kubernetes management platform that enables platform teams automate the entire lifecycle of K8s clusters, including provisioning, scaling, upgrading, and monitoring. For companies that are embracing a multi-cloud approach, visibility and effective monitoring of clusters require use of disparate tools. Rafay provides various tools and features to centralize manage the cluster estate and track the performance, health, and resource utilization of your Kubernetes clusters and workloads.
Here are some key aspects of Rafay's monitoring solution:
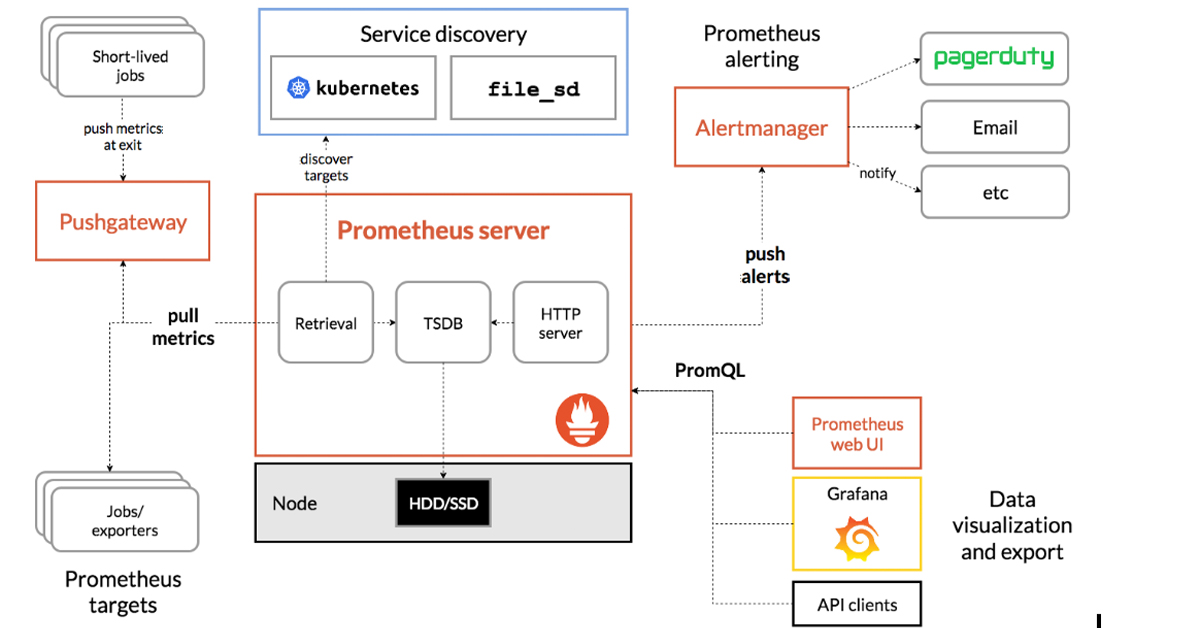
Integration with Prometheus
Rafay has in-built integration with Prometheus, which is a popular open-source monitoring and alerting toolkit for Kubernetes, to collect and store metrics from your Kubernetes clusters. Prometheus Operator provides a Kubernetes native deployment and management of Prometheus and related monitoring components. It uses Kubernetes custom resources to simplify and streamline the deployment and configuration of Prometheus. Specifically, it allows users to define and manage monitoring instances as Kubernetes resources.
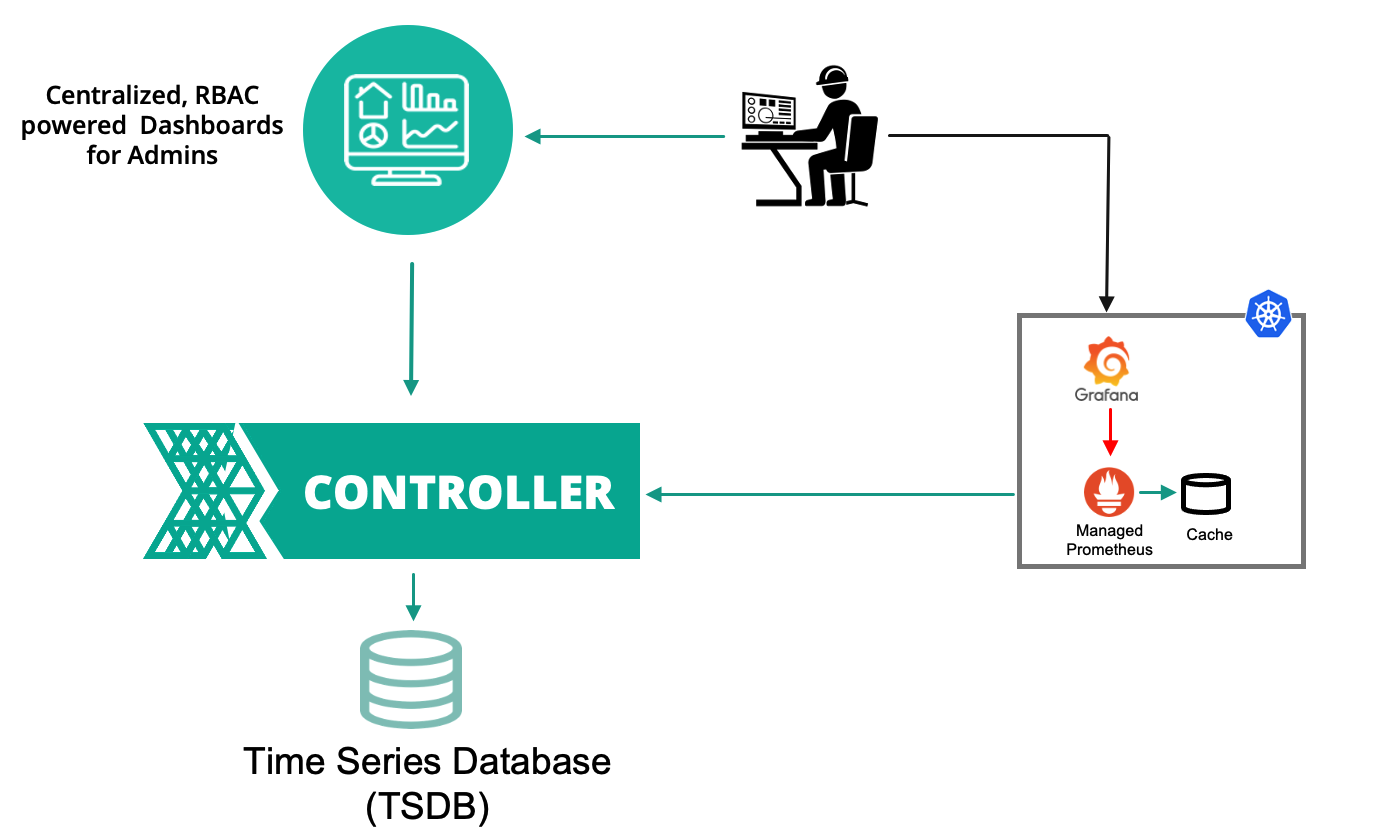
Grafana Integration
Rafay integrates with Grafana, which is another popular open-source to create a dashboard and visualization platform that works seamlessly with Prometheus to create custom dashboards and visualizations for monitoring your Kubernetes clusters and applications. Grafana allows you to create informative, real-time graphs and charts based on Prometheus data.
Application Performance Monitoring (APM)
Rafay provides seamless integration with APM tools like Newrelic, Splunk Connect, Dynatrace, Cloudwatch or Datadog to gain deeper insights into your application's performance. This helps to provide detailed insights into your application's behavior, including transaction tracing, code-level performance, and error tracking.
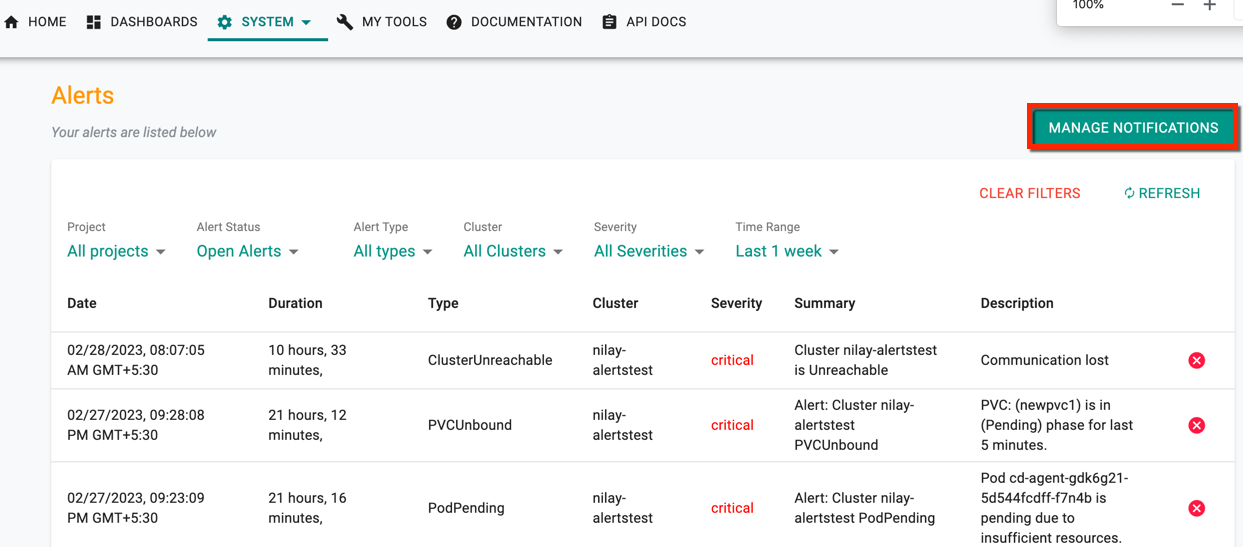
Alerting and Notifications
Apart from the option for users to view alerts & notifications generated due to cluster health on Rafay UI, it is also possible to configure alerting rules in Prometheus and integrate with alerting tools like Slack, email, Microsoft Teams, Service Now, OpsGenie or PagerDuty to ensure that you are informed and take action on any critical issues promptly.
Log Management
In addition to metrics and to enable users access to audit logs, Rafay can also help you manage logs generated by your Kubernetes workloads. You can integrate Rafay with log management solutions like Elasticsearch, Fluentbit, Kibana, EFK stack, SumoLogic and Splunk for centralized log collection, storage and analysis.
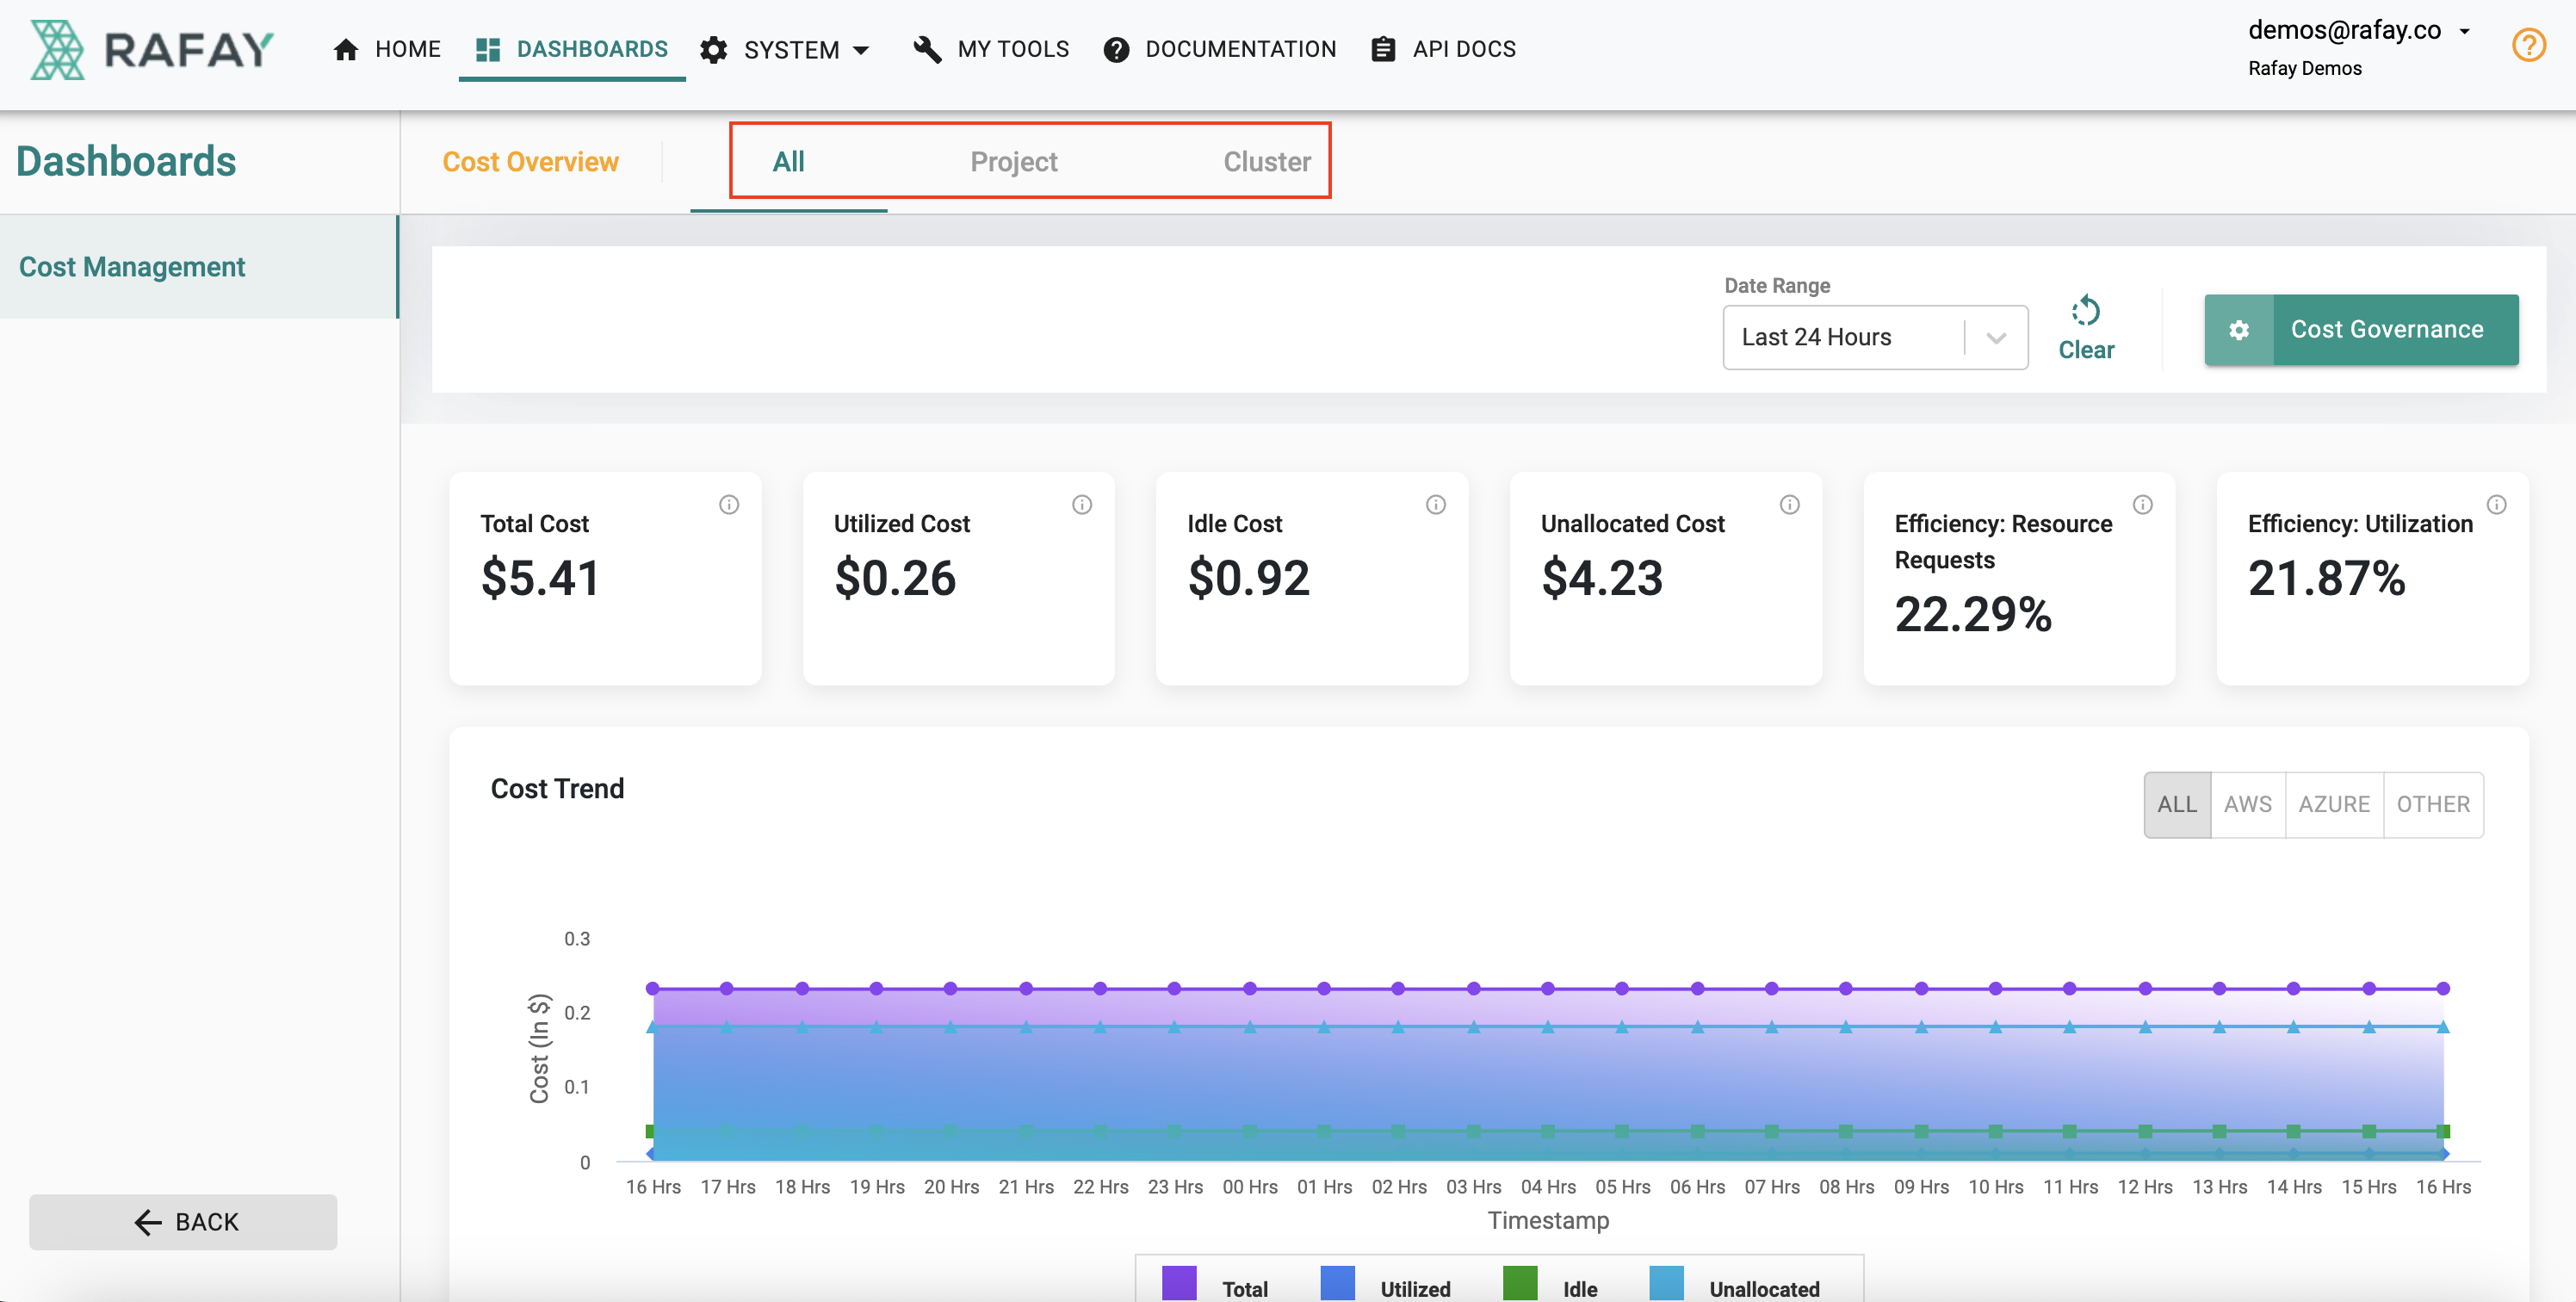
Resource Utilization and Cost Monitoring
As organizations adopt and scale their K8s environments, they often find themselves running blind struggling to get to a ‘good enough’ appreciation of their cost structure. Rafay provides an integrated Cost Management solution to implement chargeback/showback models and carry our right sizing exercises for cost optimization.
Summary
Rafay's Kubernetes monitoring capabilities are designed to provide comprehensive insights into the health, performance and cost of your Kubernetes infrastructure and applications. By leveraging the platform's capabilities and integration with popular monitoring and observability tools, you can ensure that your K8s infrastructure is reliable, scalable and optimized from a cost perspective.
Blog Ideas
Sincere thanks to readers of our blog who spend time reading our product blogs. Please Contact the Rafay Product Team if you would like us to write about other topics.